Metabase, Retool, Data Studio: Building Insights Fast
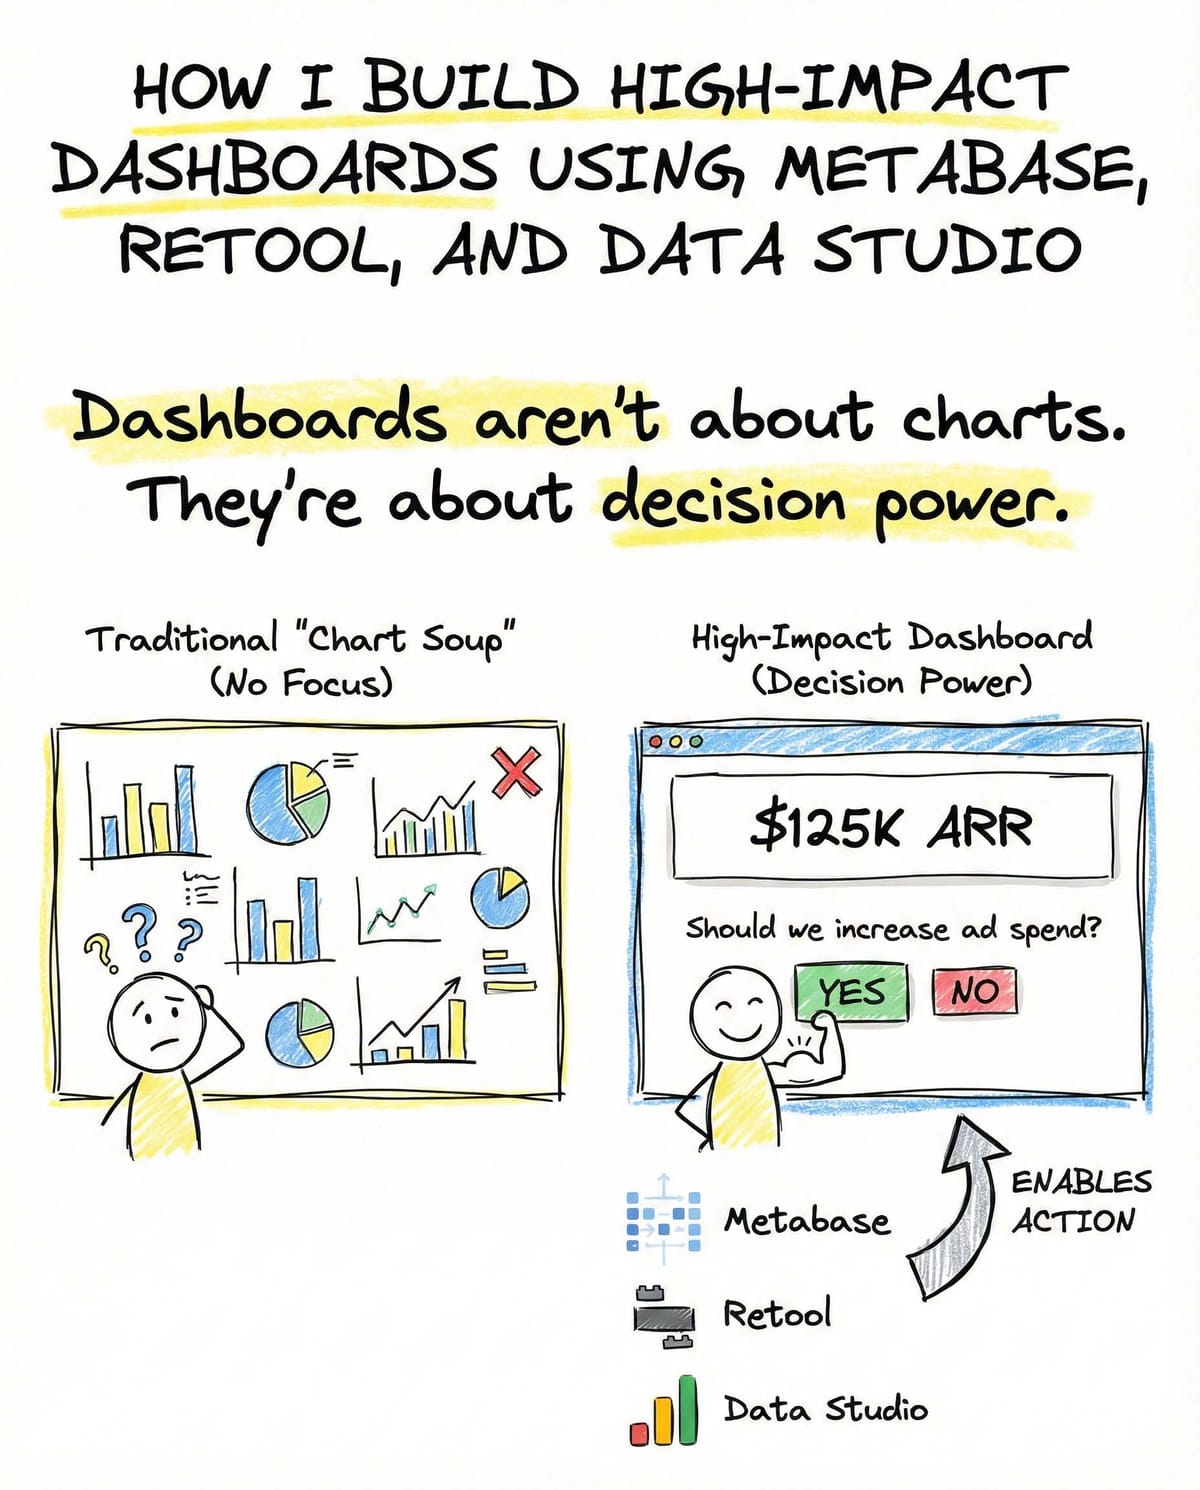
How I build high-impact dashboards fast
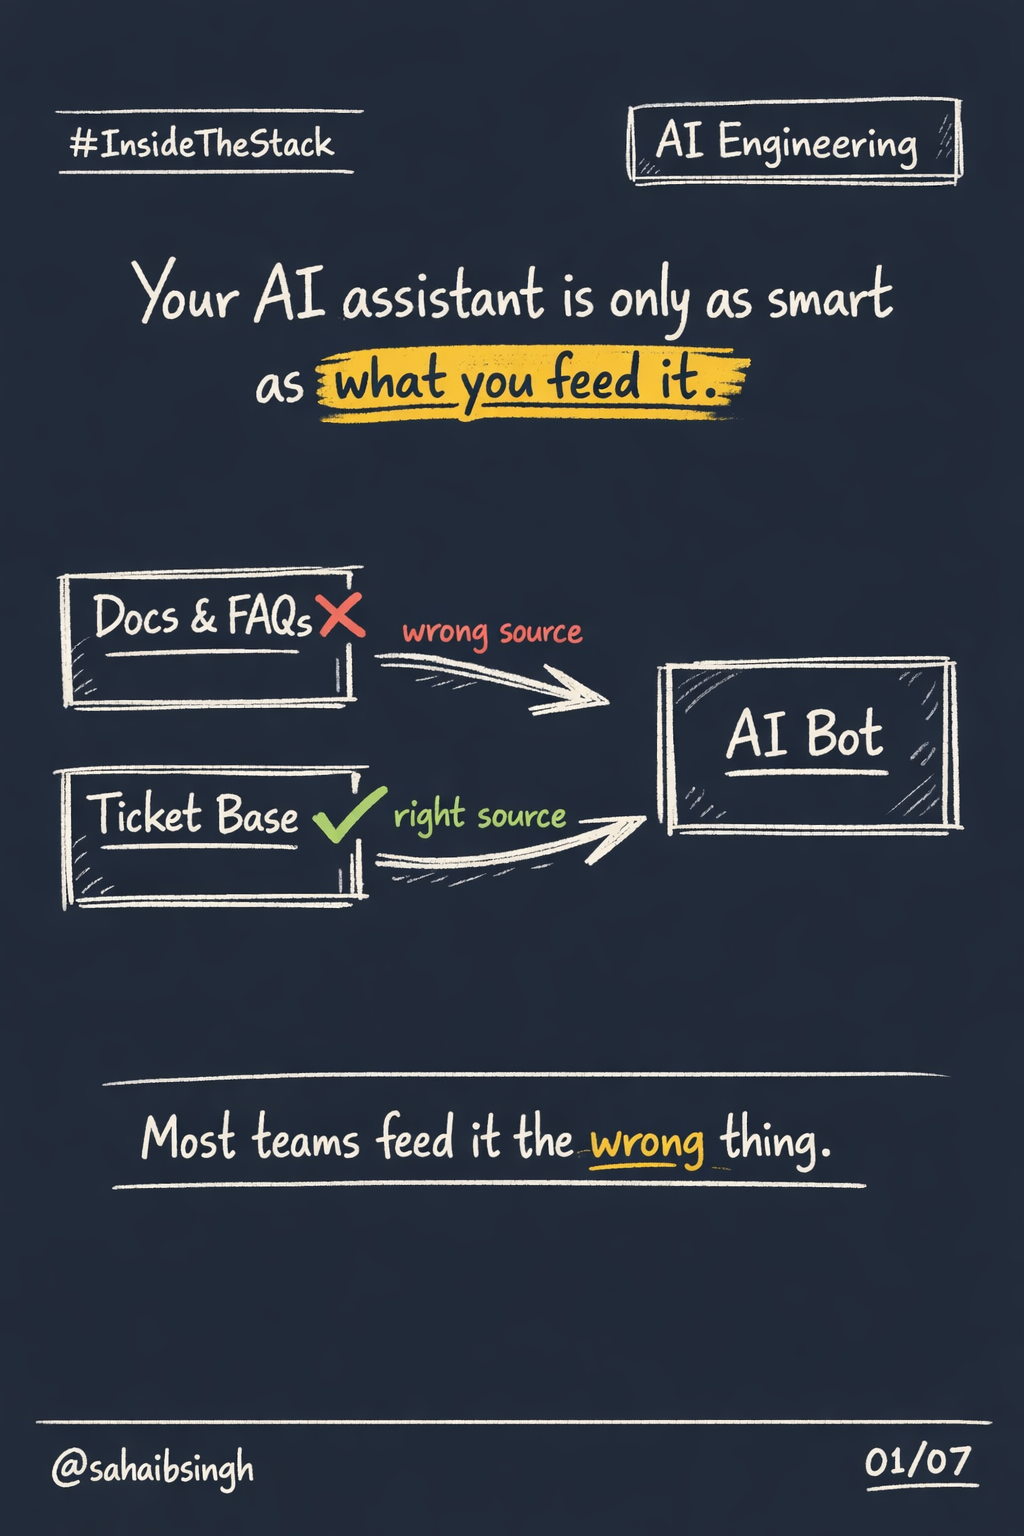
Dashboards are misunderstood.
They are not about charts.
They are about decision power.
A dashboard that looks good but does not change behavior is a failure.
Why dashboards actually matter
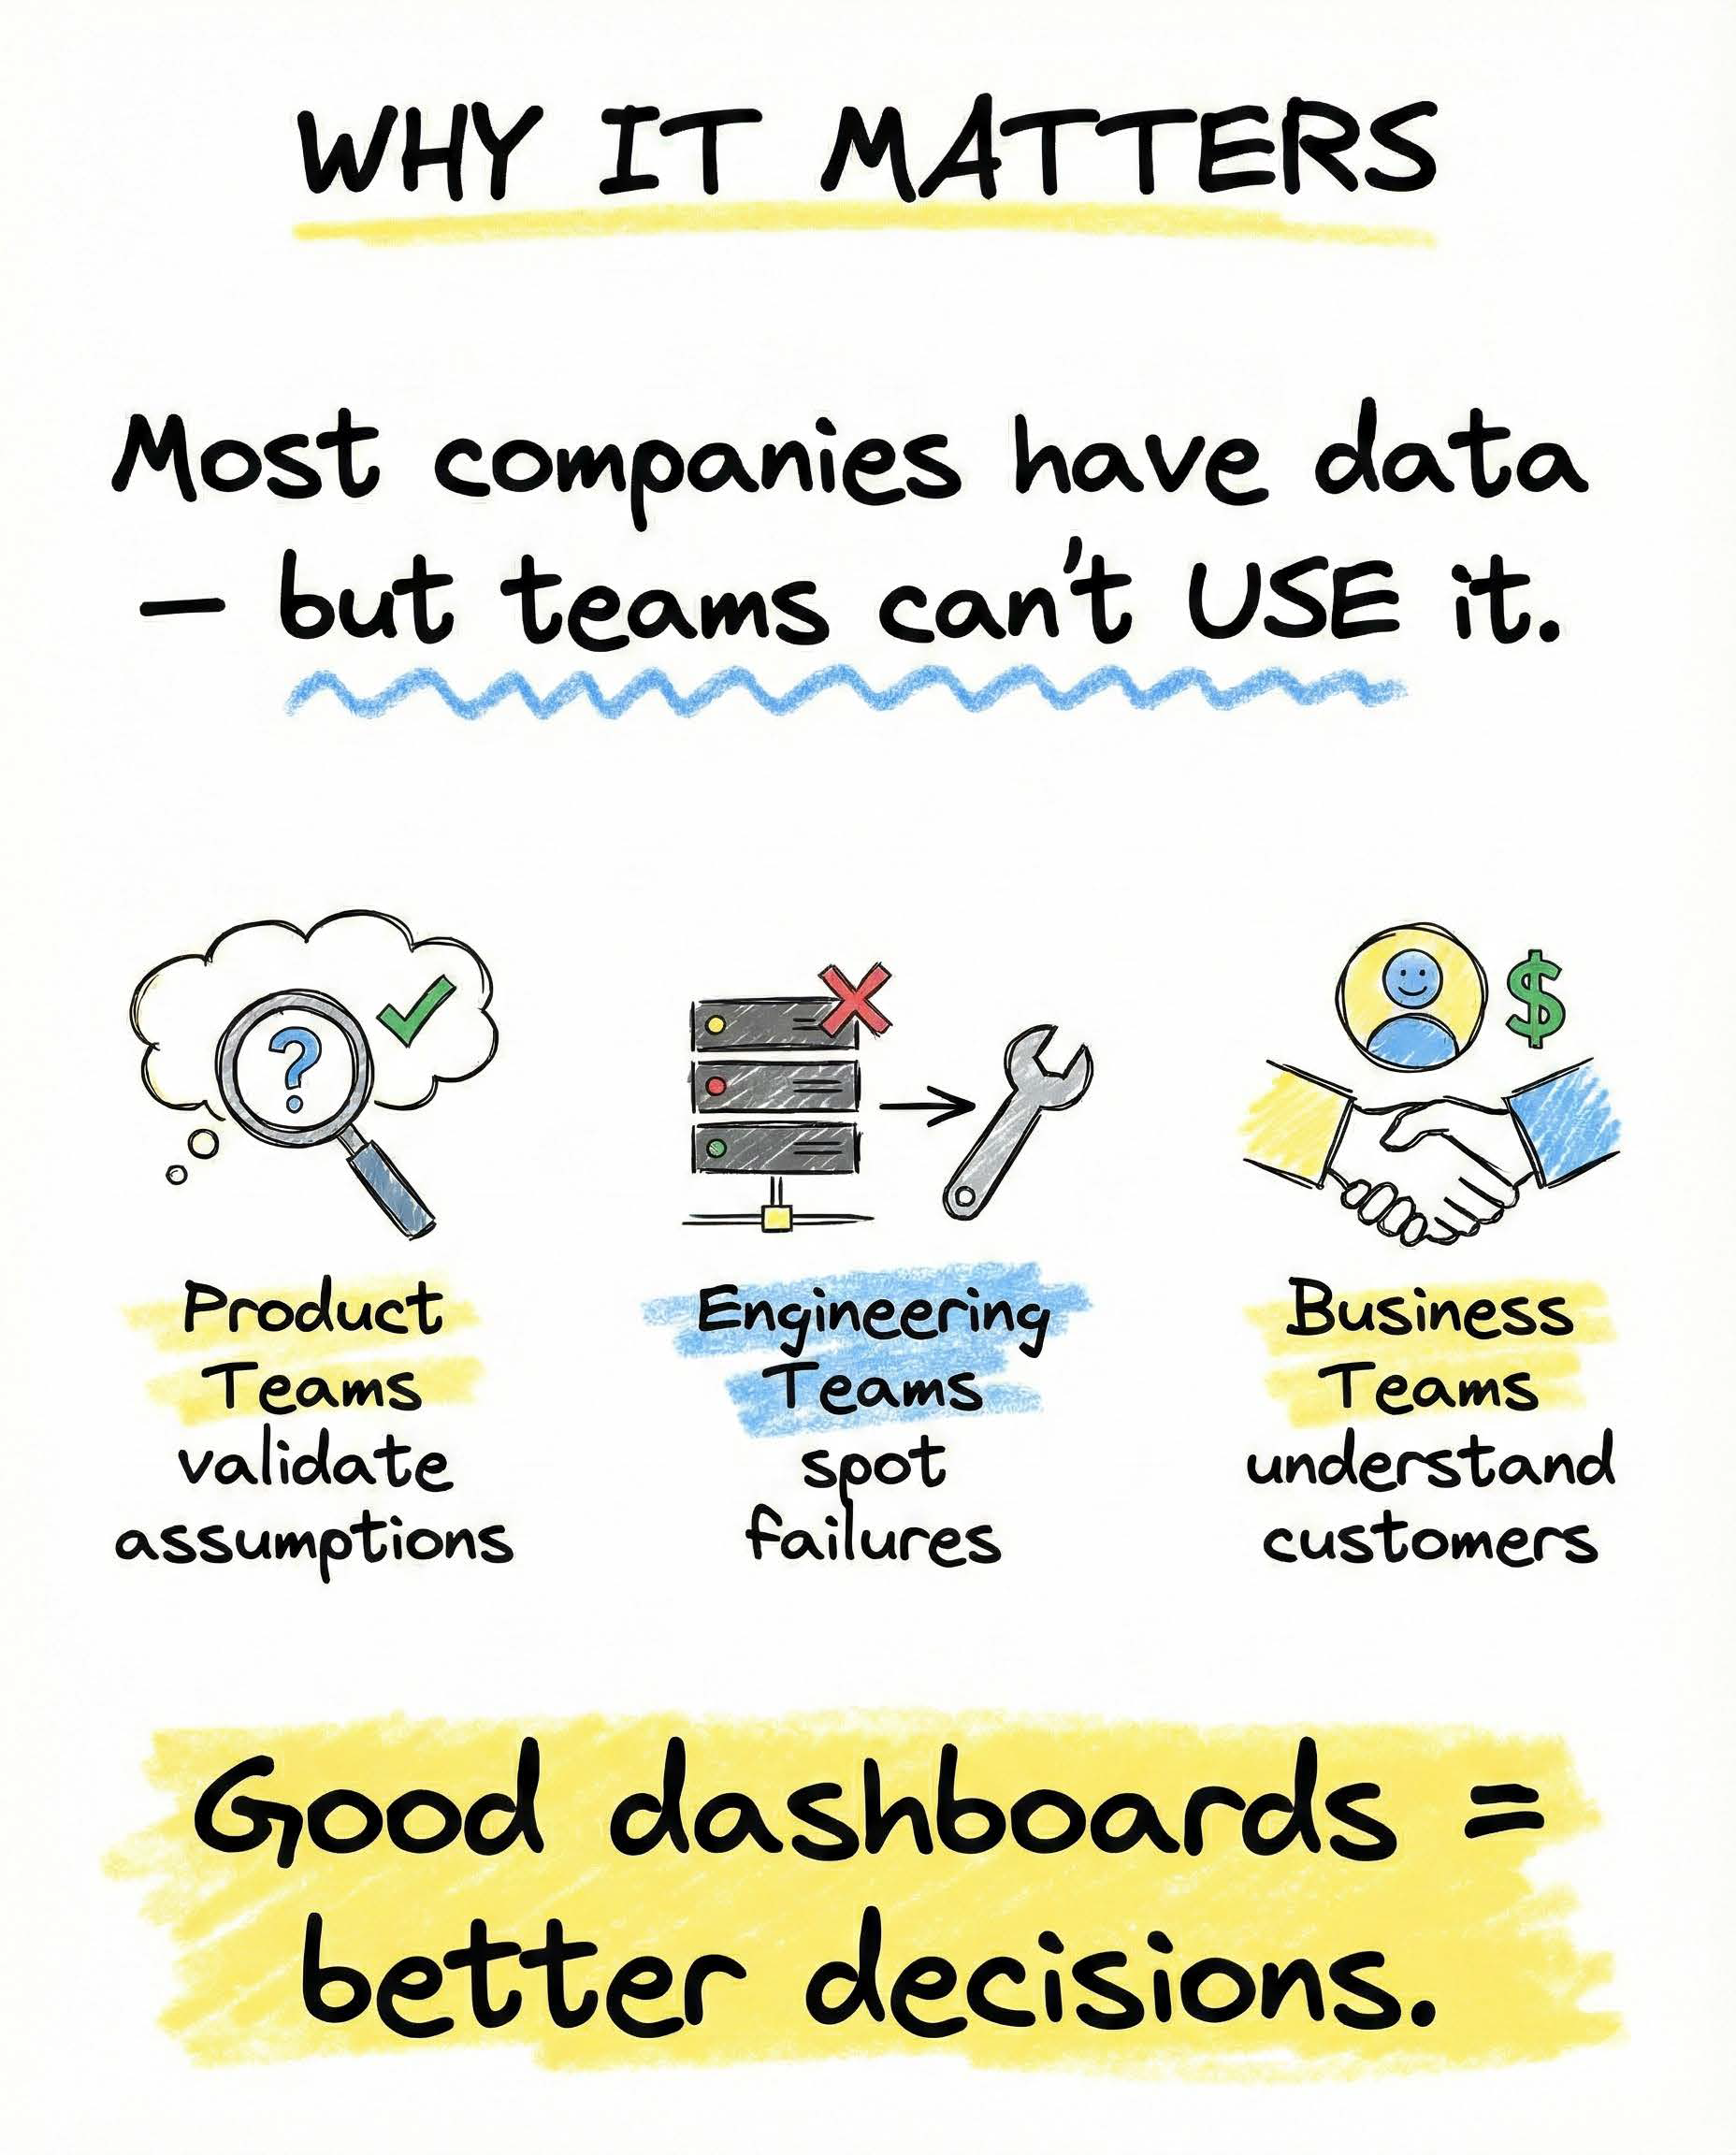
Most companies already have data.
The real problem is that teams cannot use it.
Good dashboards help:
- product teams validate assumptions
- engineering teams spot failures early
- business teams understand customer behavior
When dashboards work, decisions speed up.
When they do not, people stop trusting the data.
Choosing the right tool for the job
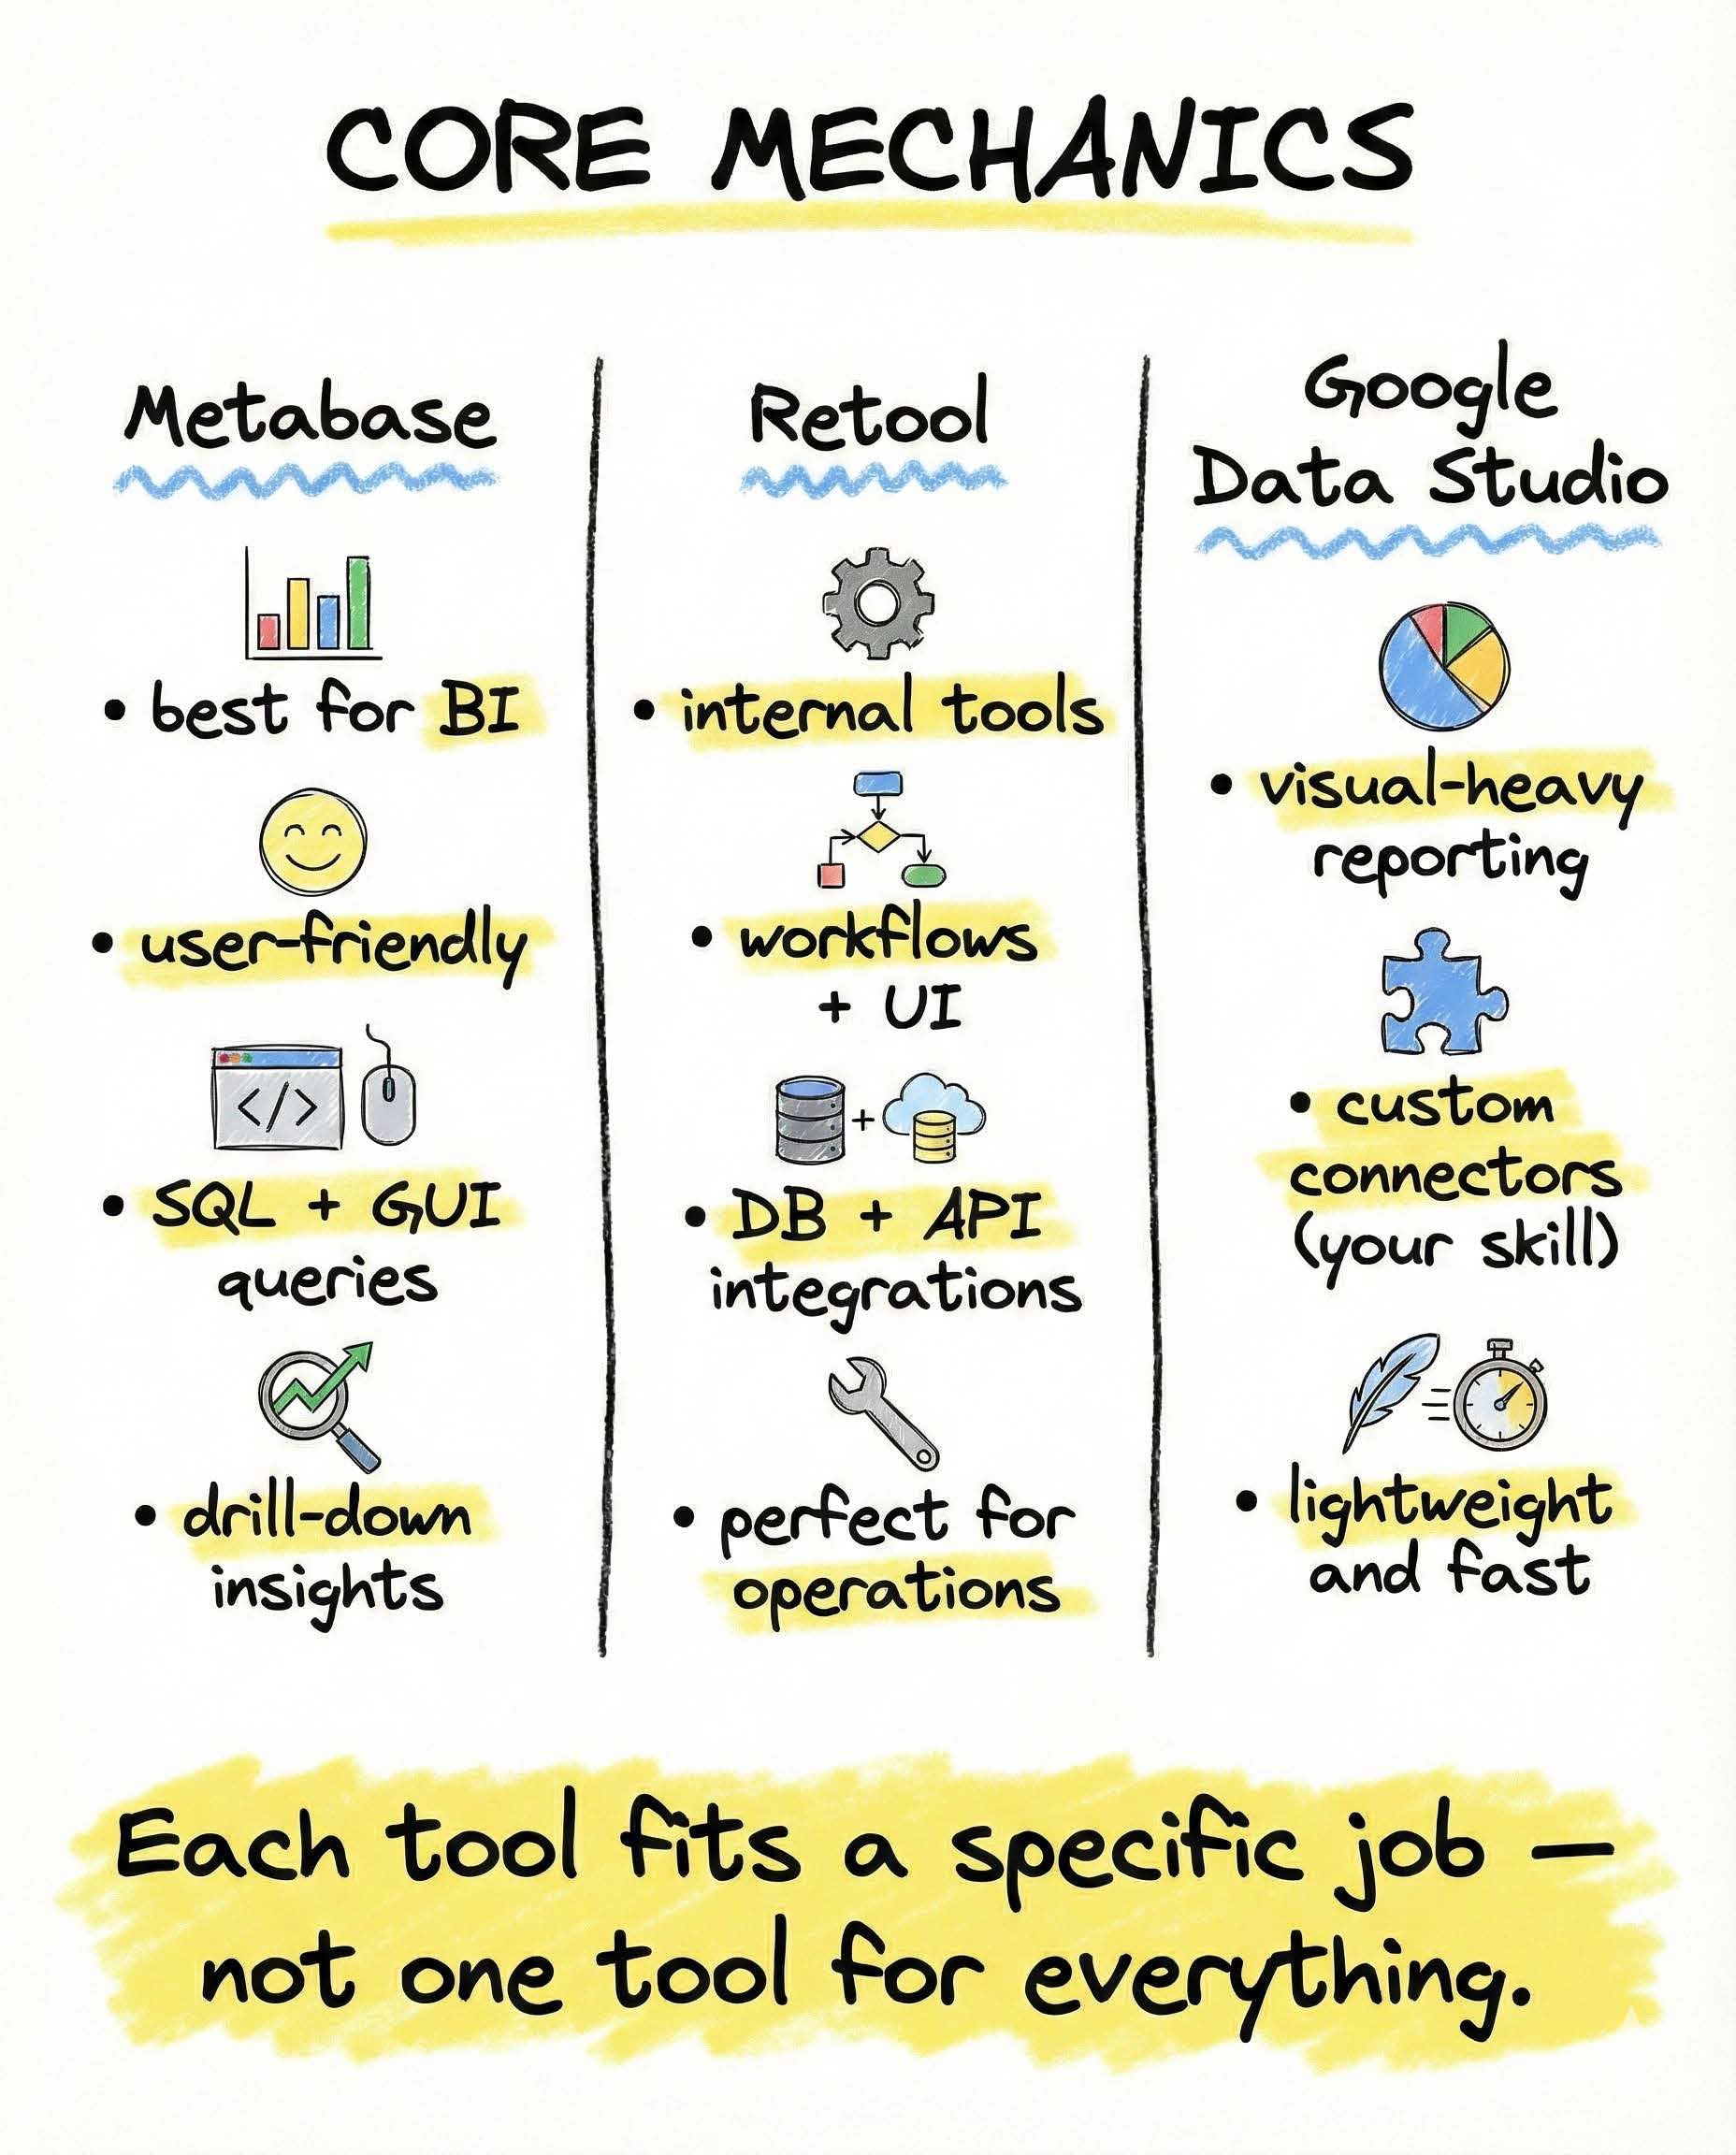
There is no universal dashboard tool. Each exists for a reason.
Metabase
Best suited for BI use cases.
- very user friendly
- supports SQL and GUI-based queries
- great for drill-down exploration
- easy adoption across teams
Metabase shines when insight discovery matters.
Retool
Built for internal tools and operations.
- custom workflows and UI
- deep database and API integrations
- excellent for ops, support, and admin tooling
Retool is not BI.
It is where actions happen.
Google Data Studio
Lightweight and visual-first.
- fast reporting
- presentation-friendly layouts
- powerful when paired with custom connectors
- easy sharing
Data Studio works well when clarity and speed matter more than depth.
One tool per problem beats one tool for everything.
Making dashboards scale
Most dashboard performance issues are self-inflicted.
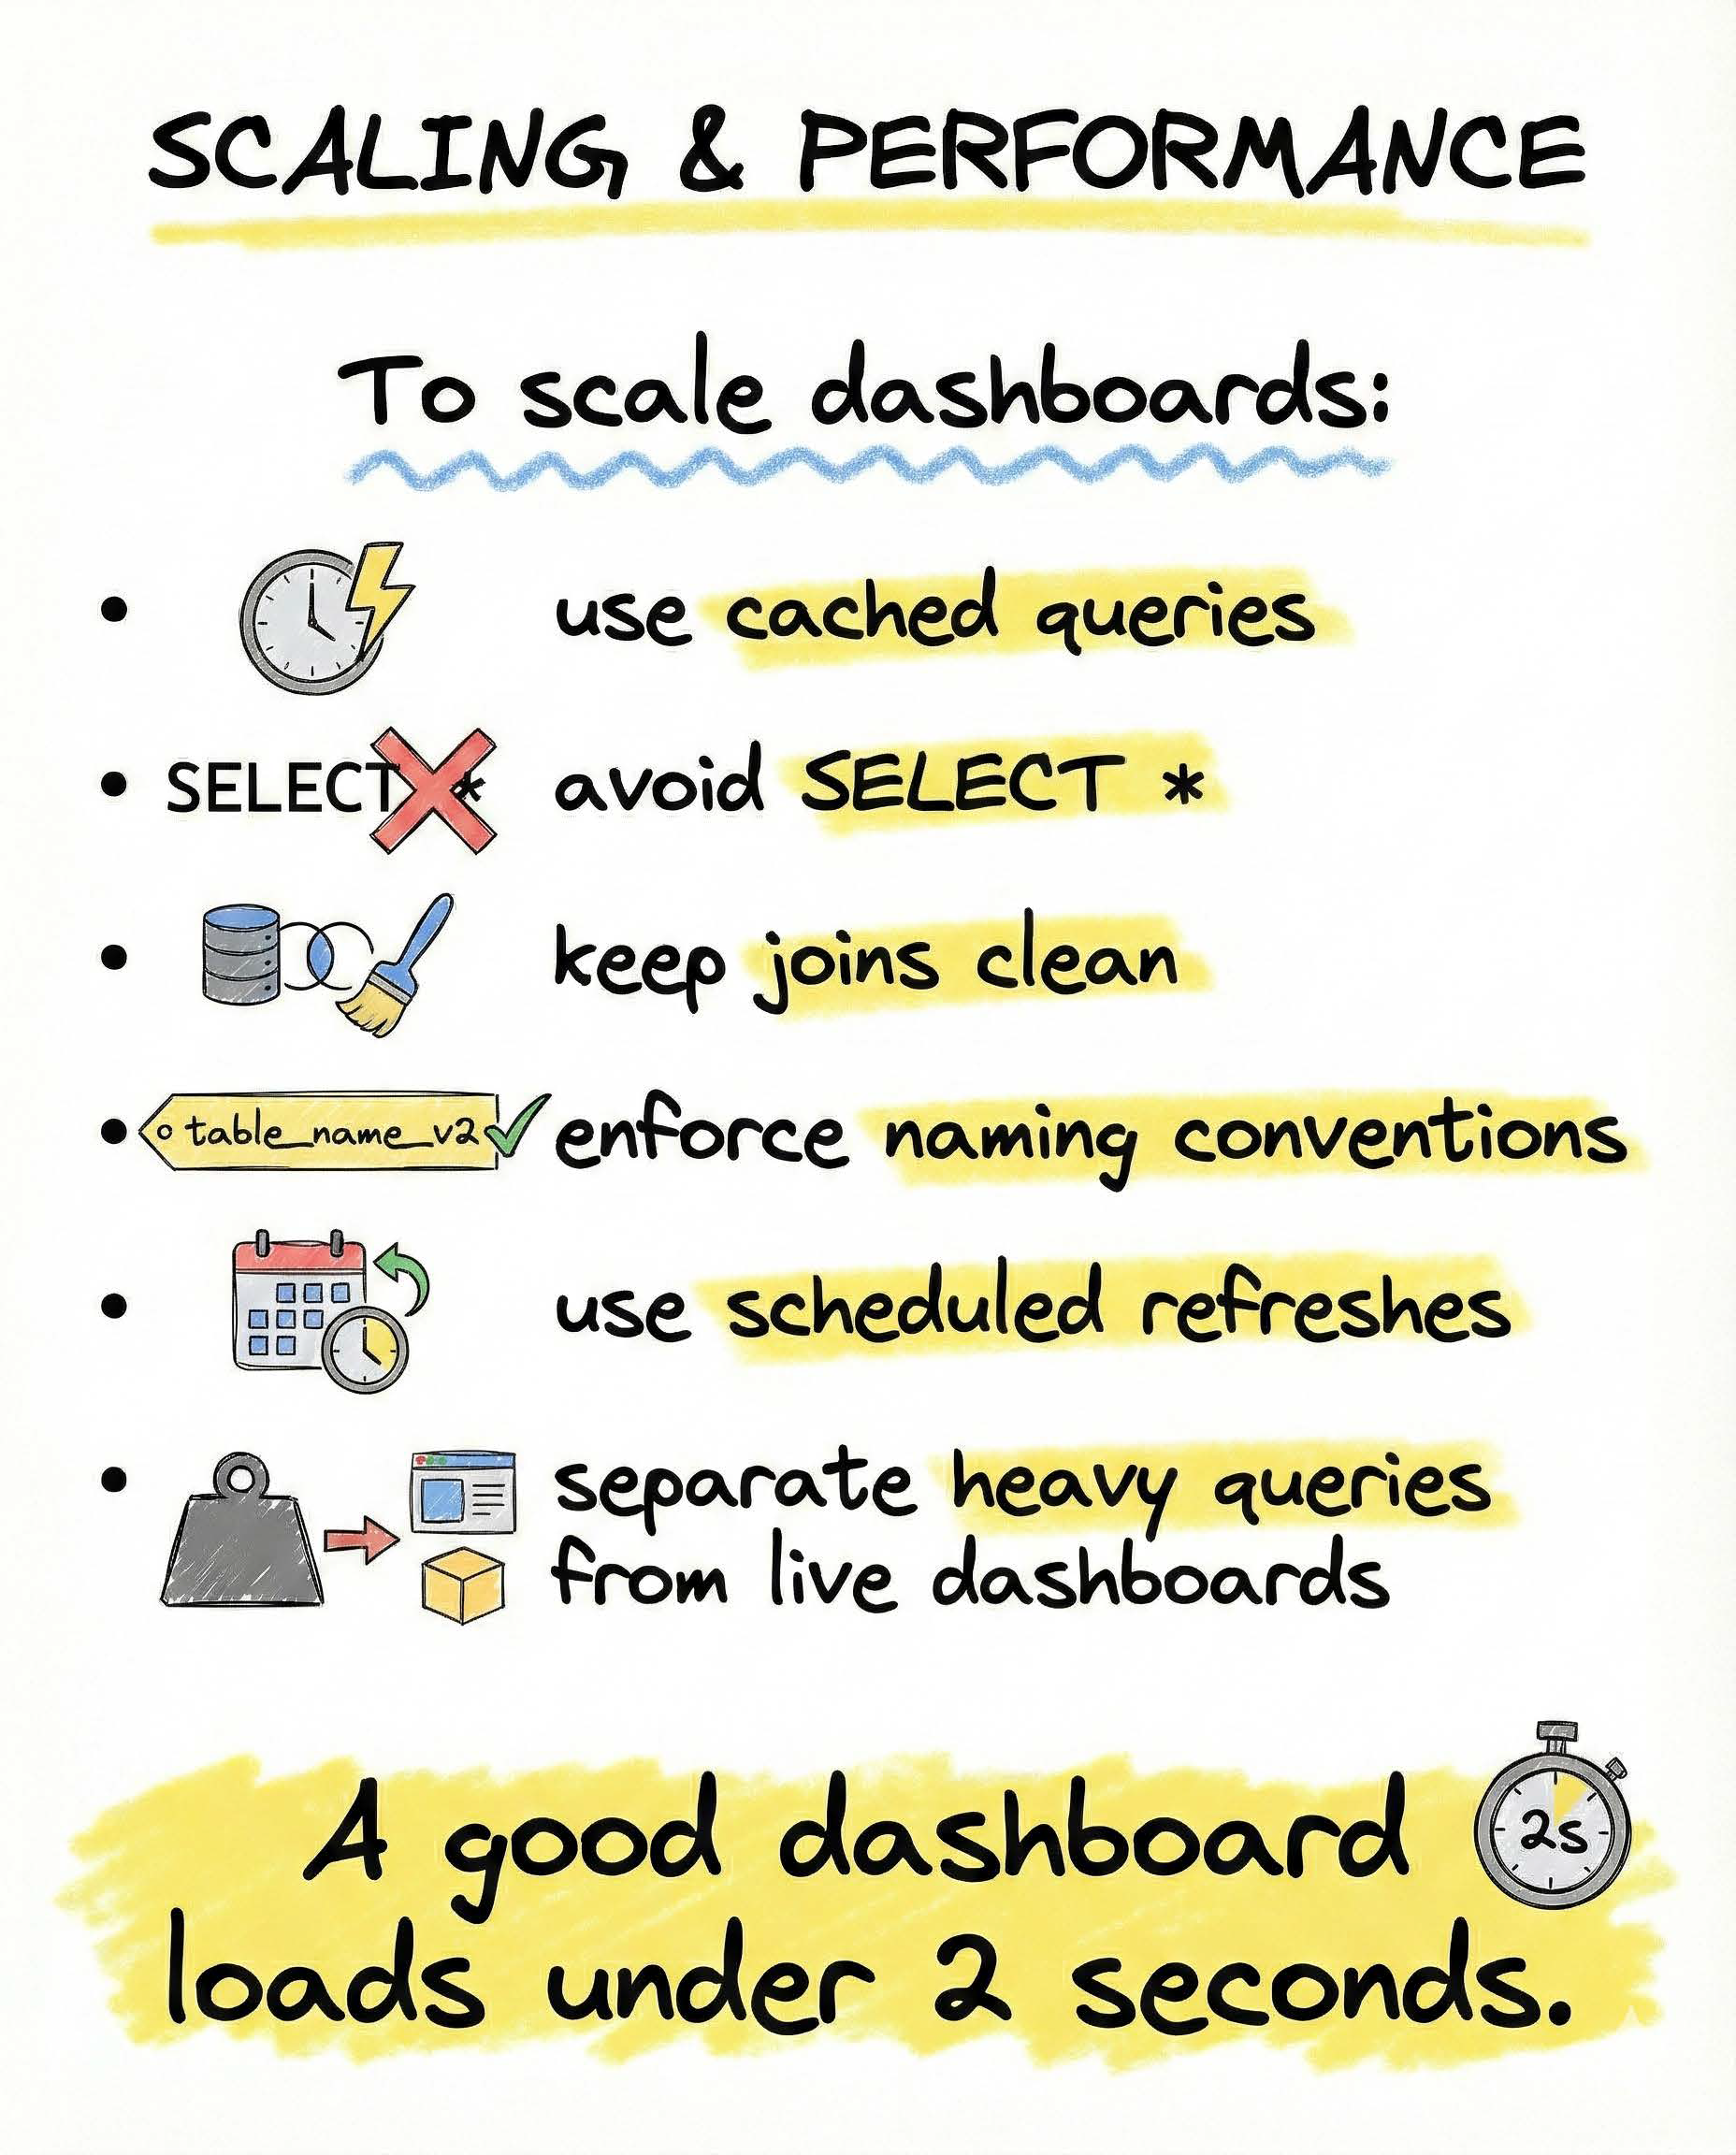
Rules that keep things fast:
- cache expensive queries
- never use
SELECT *in production dashboards - keep joins simple and intentional
- enforce clear naming conventions
- use scheduled refreshes
- separate heavy analysis from live views
A good dashboard should load in under two seconds.
Anything slower breaks trust.
How I approach dashboard design
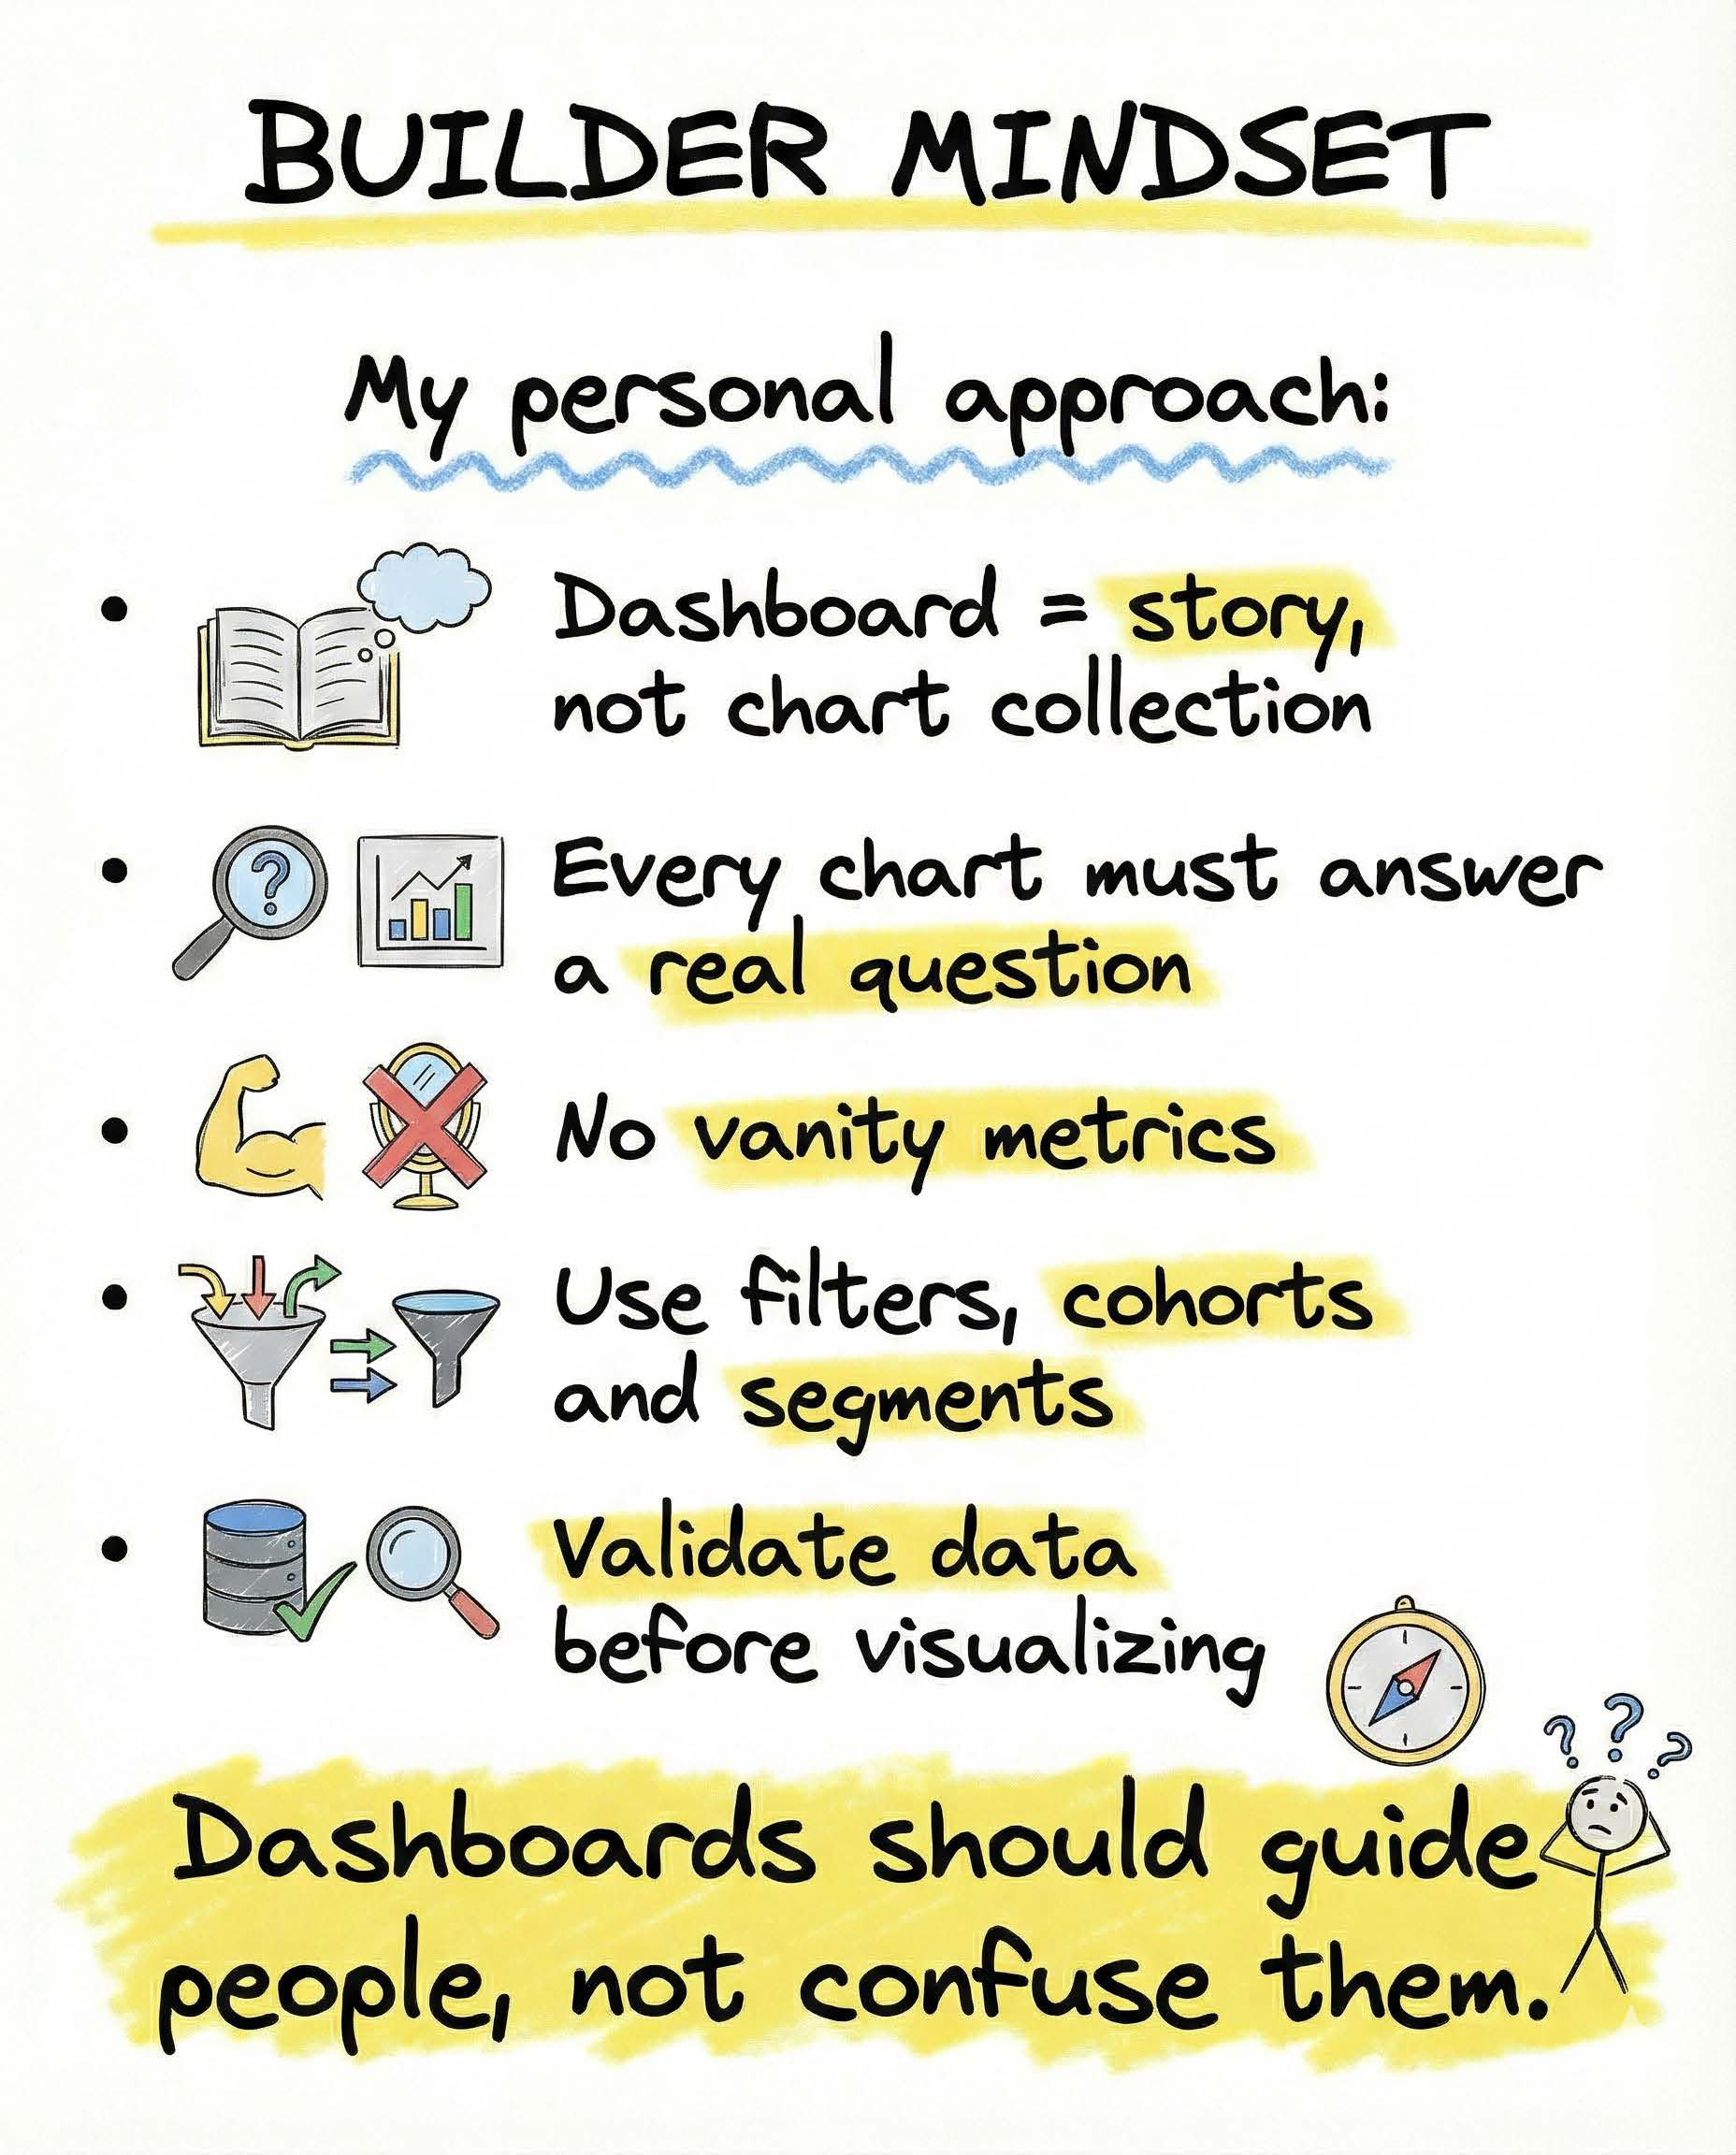
My rules are simple and ruthless:
- a dashboard tells a story
- every chart must answer a real question
- no vanity metrics
- filters, cohorts, and segments are mandatory
- data is validated before it is visualized
If a chart needs explanation, it probably does not belong.
Dashboards should guide decisions, not confuse people.
The real takeaway
Dashboards are a product.
They deserve the same intent, design, and discipline.
When done right, they become a daily habit.
When done wrong, they become ignored screenshots.
Closing
This post is part of InsideTheStack, focused on real-world data and product playbooks that actually get used.
Follow along for more.
#InsideTheStack #Metabase #Retool #DataStudio