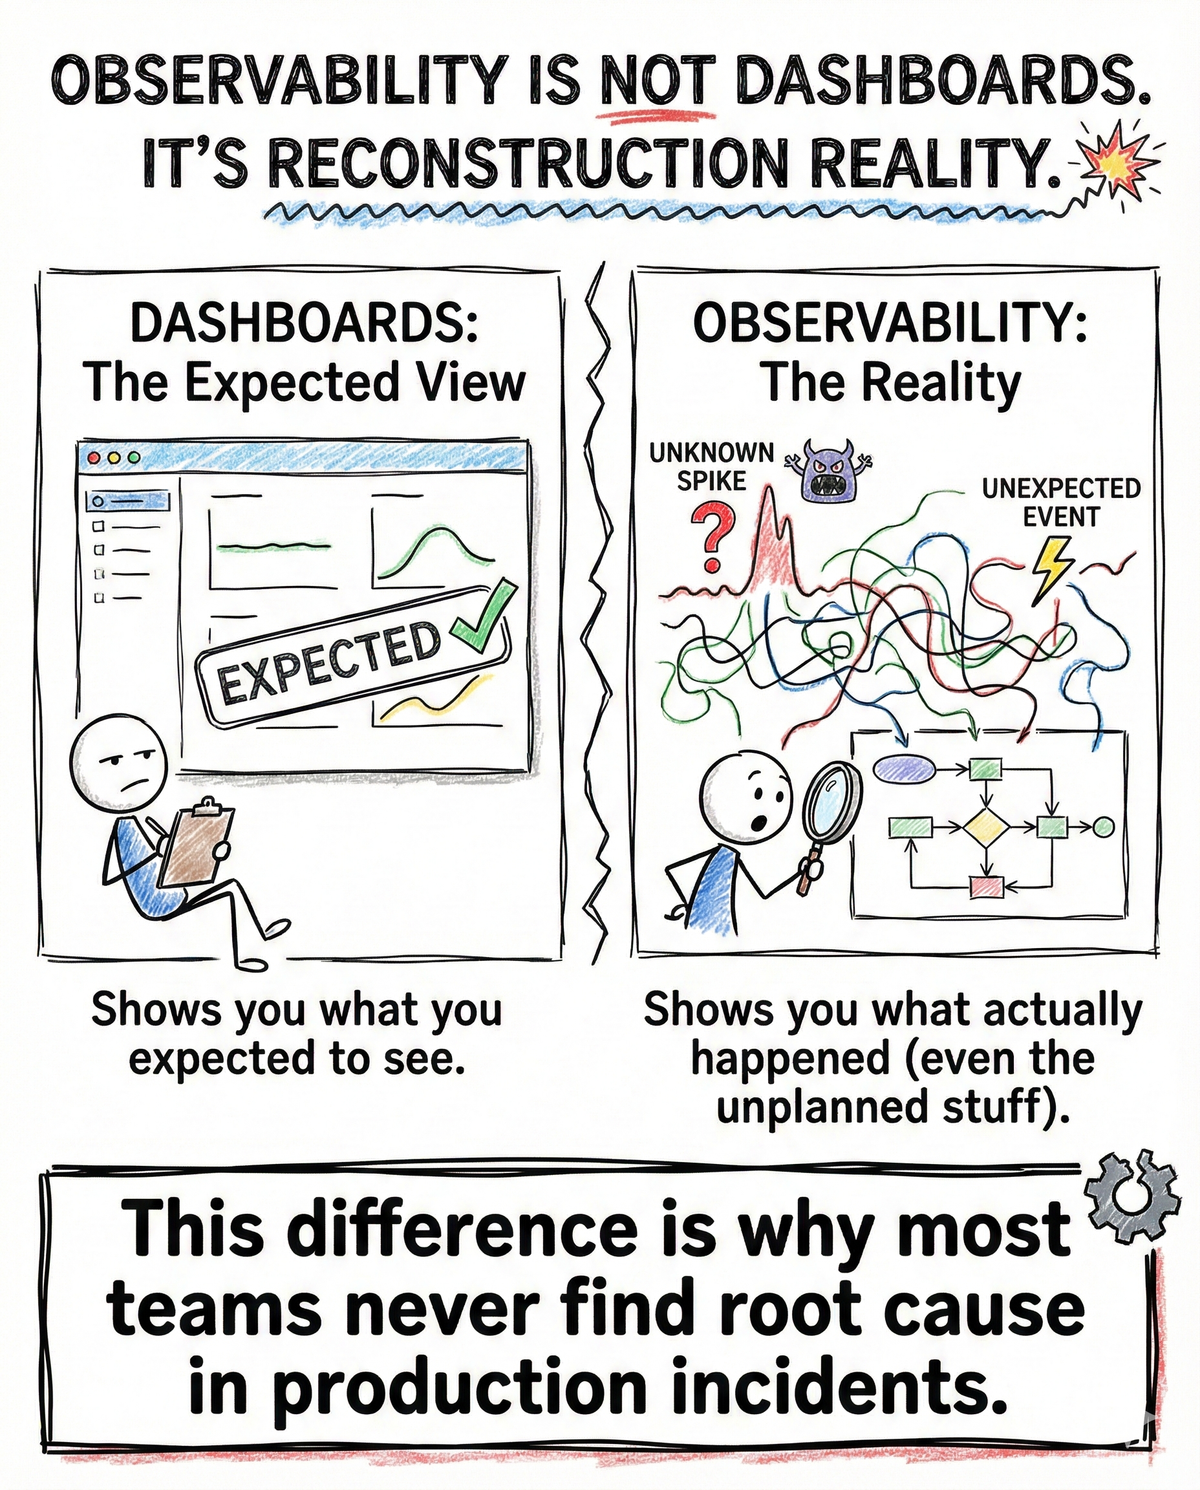
Observability Is Not Dashboards. It’s Reconstruction Reality
It is reconstruction of reality
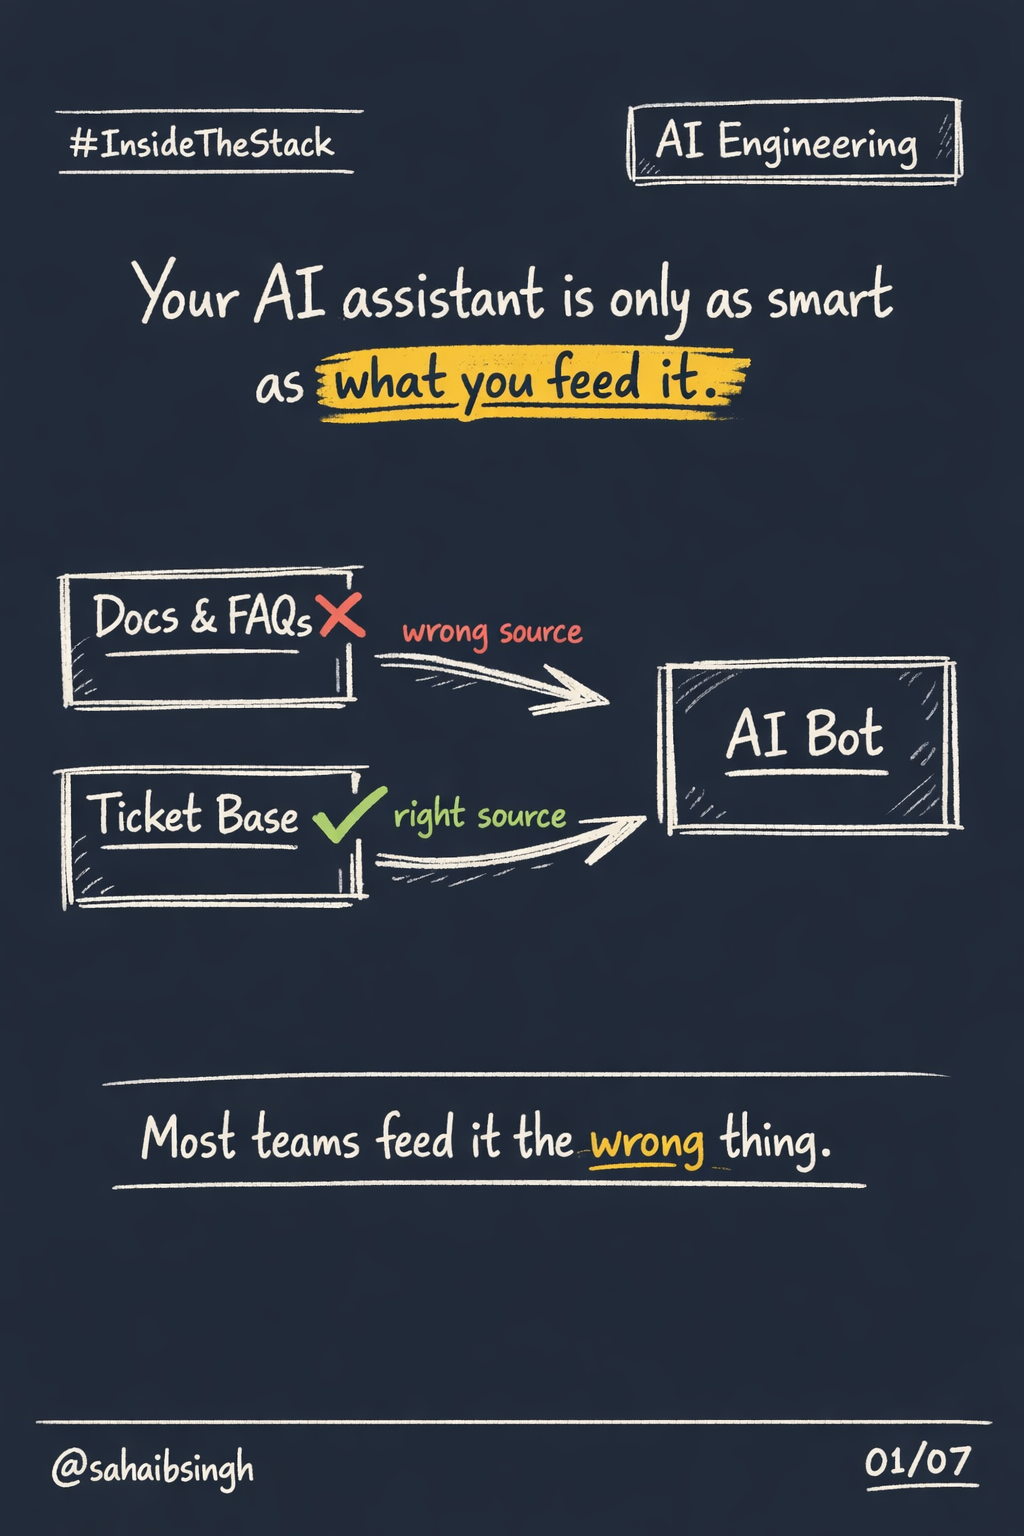
Dashboards show you what you expected to see.
Observability shows you what actually happened, including the paths you never planned for.
That difference is why most teams fail to find true root cause during production incidents.
Why this distinction matters
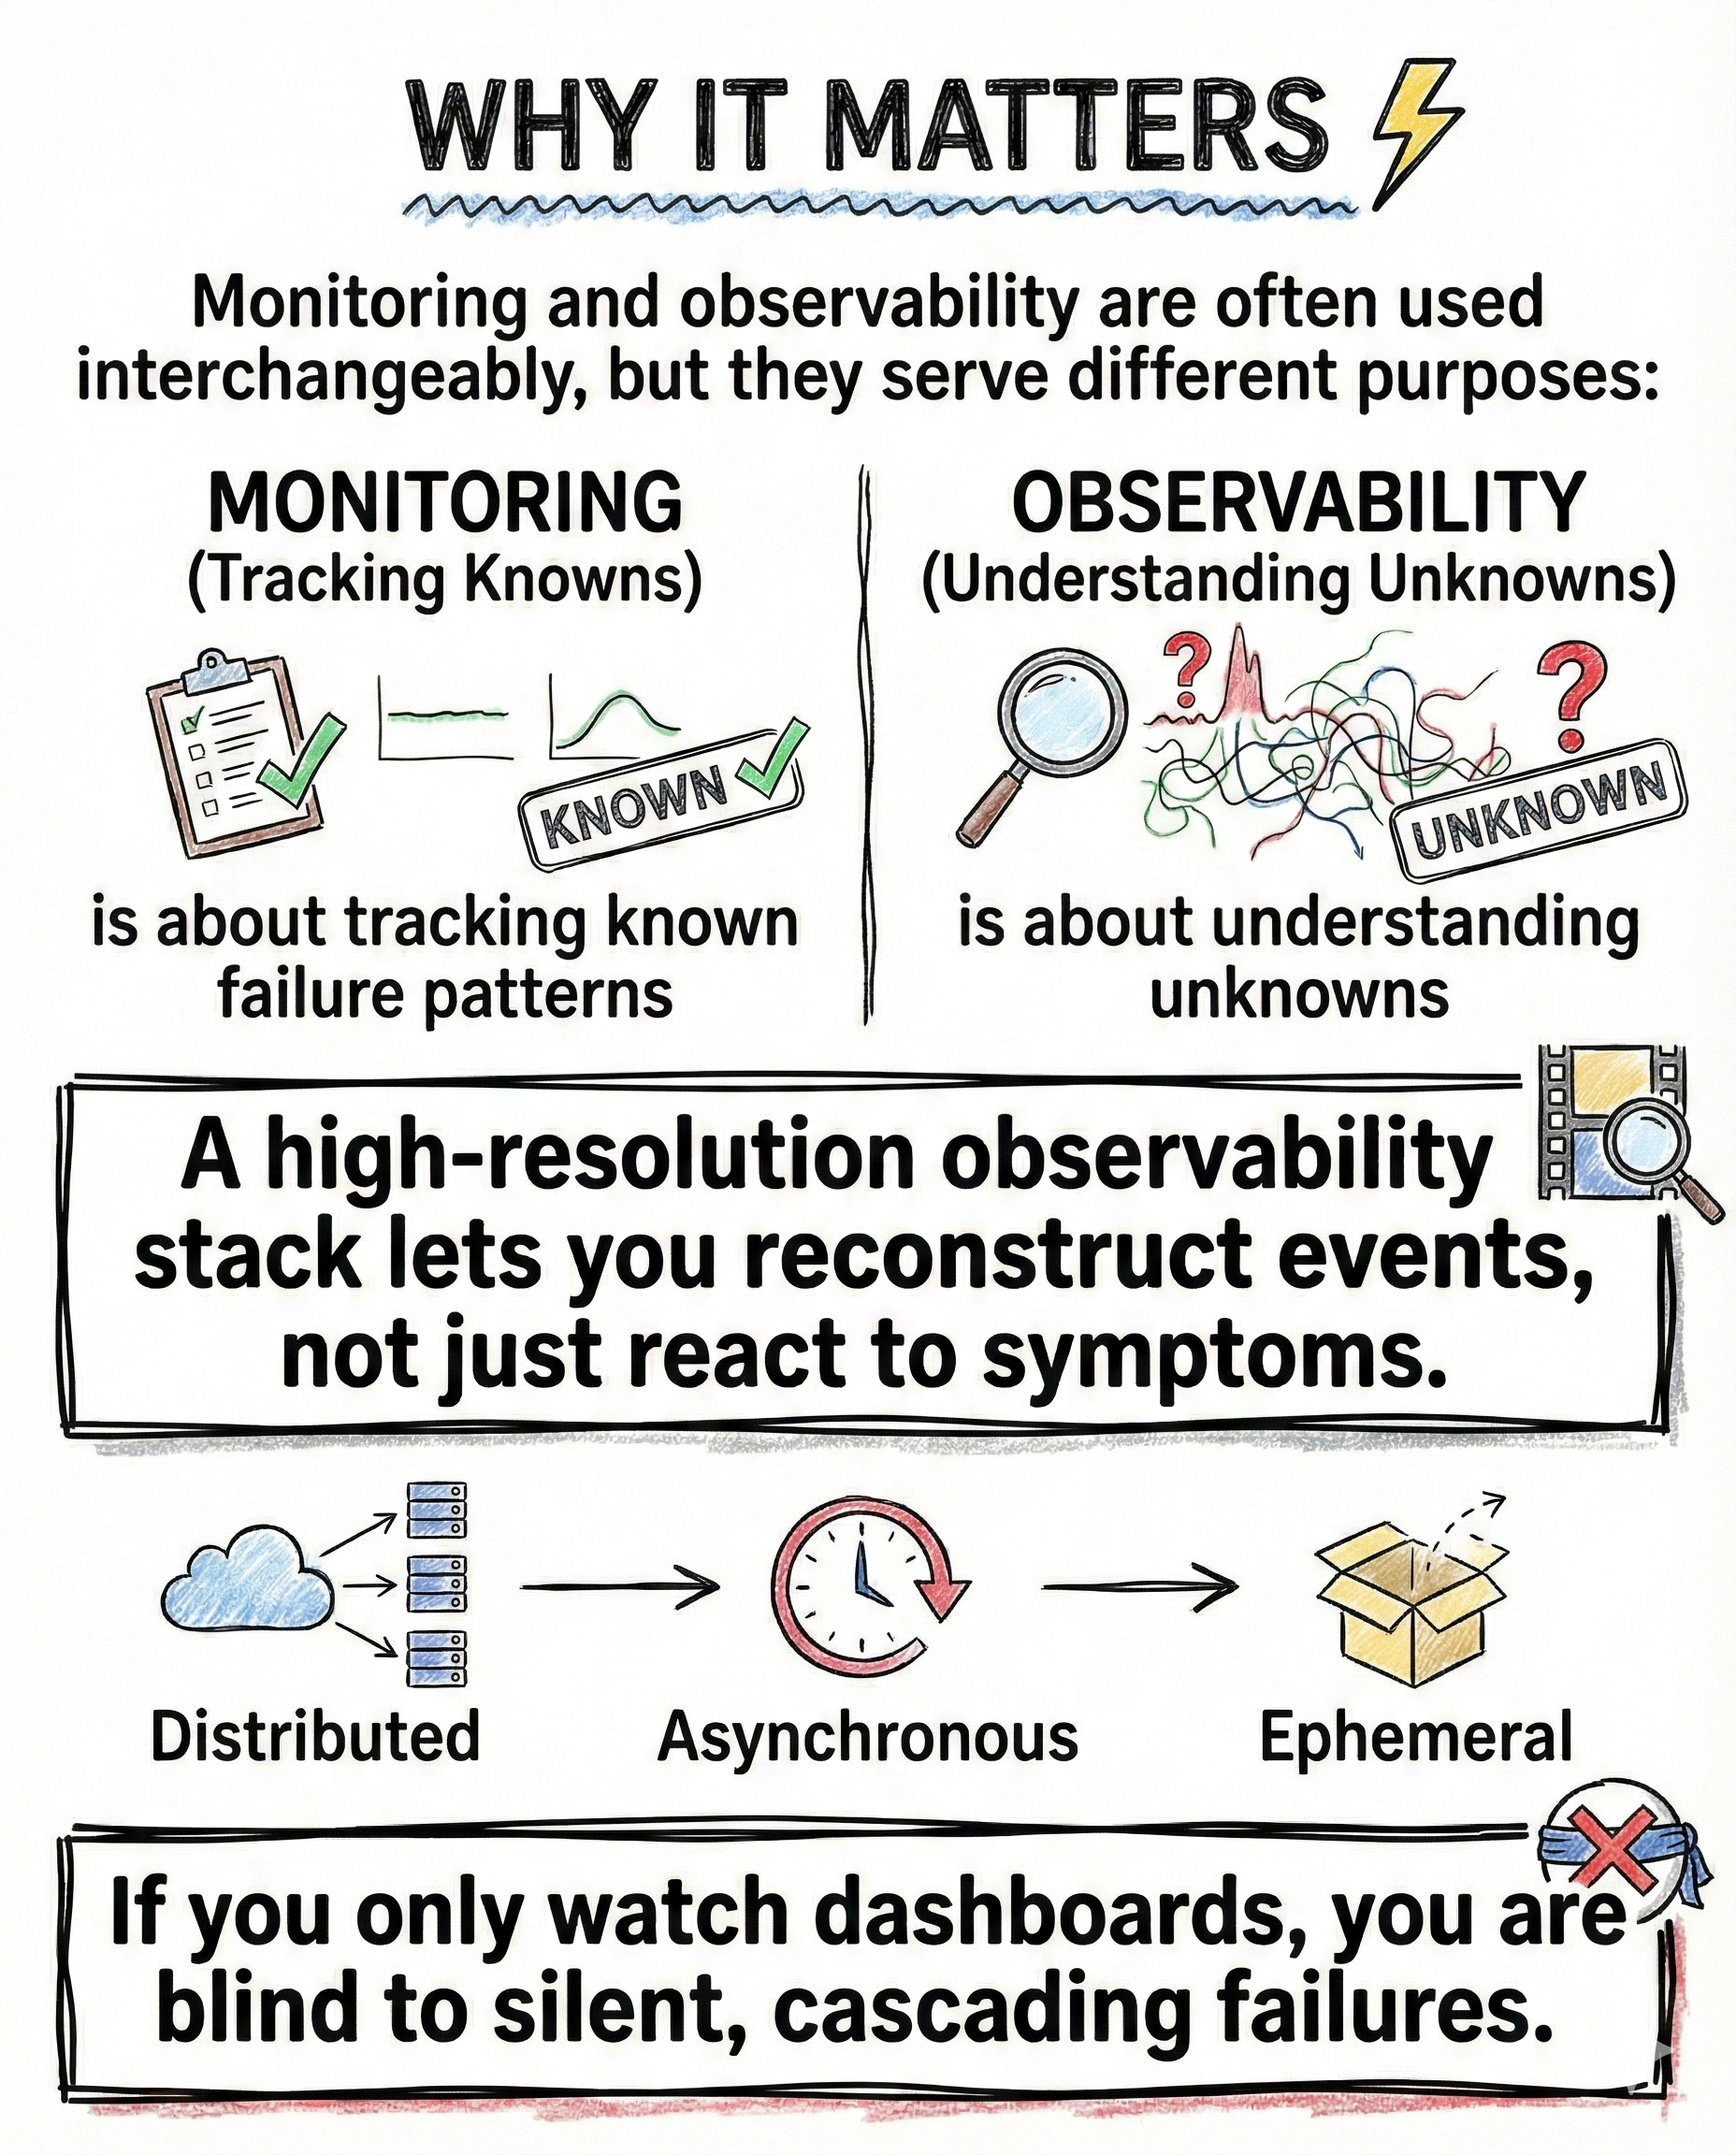
Monitoring and observability are often treated as the same thing. They are not.
- monitoring tracks known failure patterns
- observability explains unknown failures
Monitoring answers:
Is something broken?
Observability answers:
How did this break, where did it start, and why did it spread?
Modern systems are distributed, asynchronous, and partially ephemeral. If you only watch dashboards, you miss silent cascades that do not trip obvious alerts.
The three pillars that actually matter
Real observability stands on three foundations. Miss one and the picture collapses.
Logs with context
Structured logs enriched with trace IDs, user IDs, request metadata, and environment context allow events to be stitched into a coherent sequence.
Logs without context are noise.
Traces across services
Distributed tracing propagates request identity across services. This reveals the causal chain, not just the final failure.
Without traces, you guess.
Metrics with cardinality awareness
Metrics show what changed, not why it changed. High-cardinality dimensions like user, region, feature, or plan expose patterns averages hide.
Without dimensions, metrics lie by omission.
Without all three, you can detect incidents but never explain them.

Why dashboards consistently fail
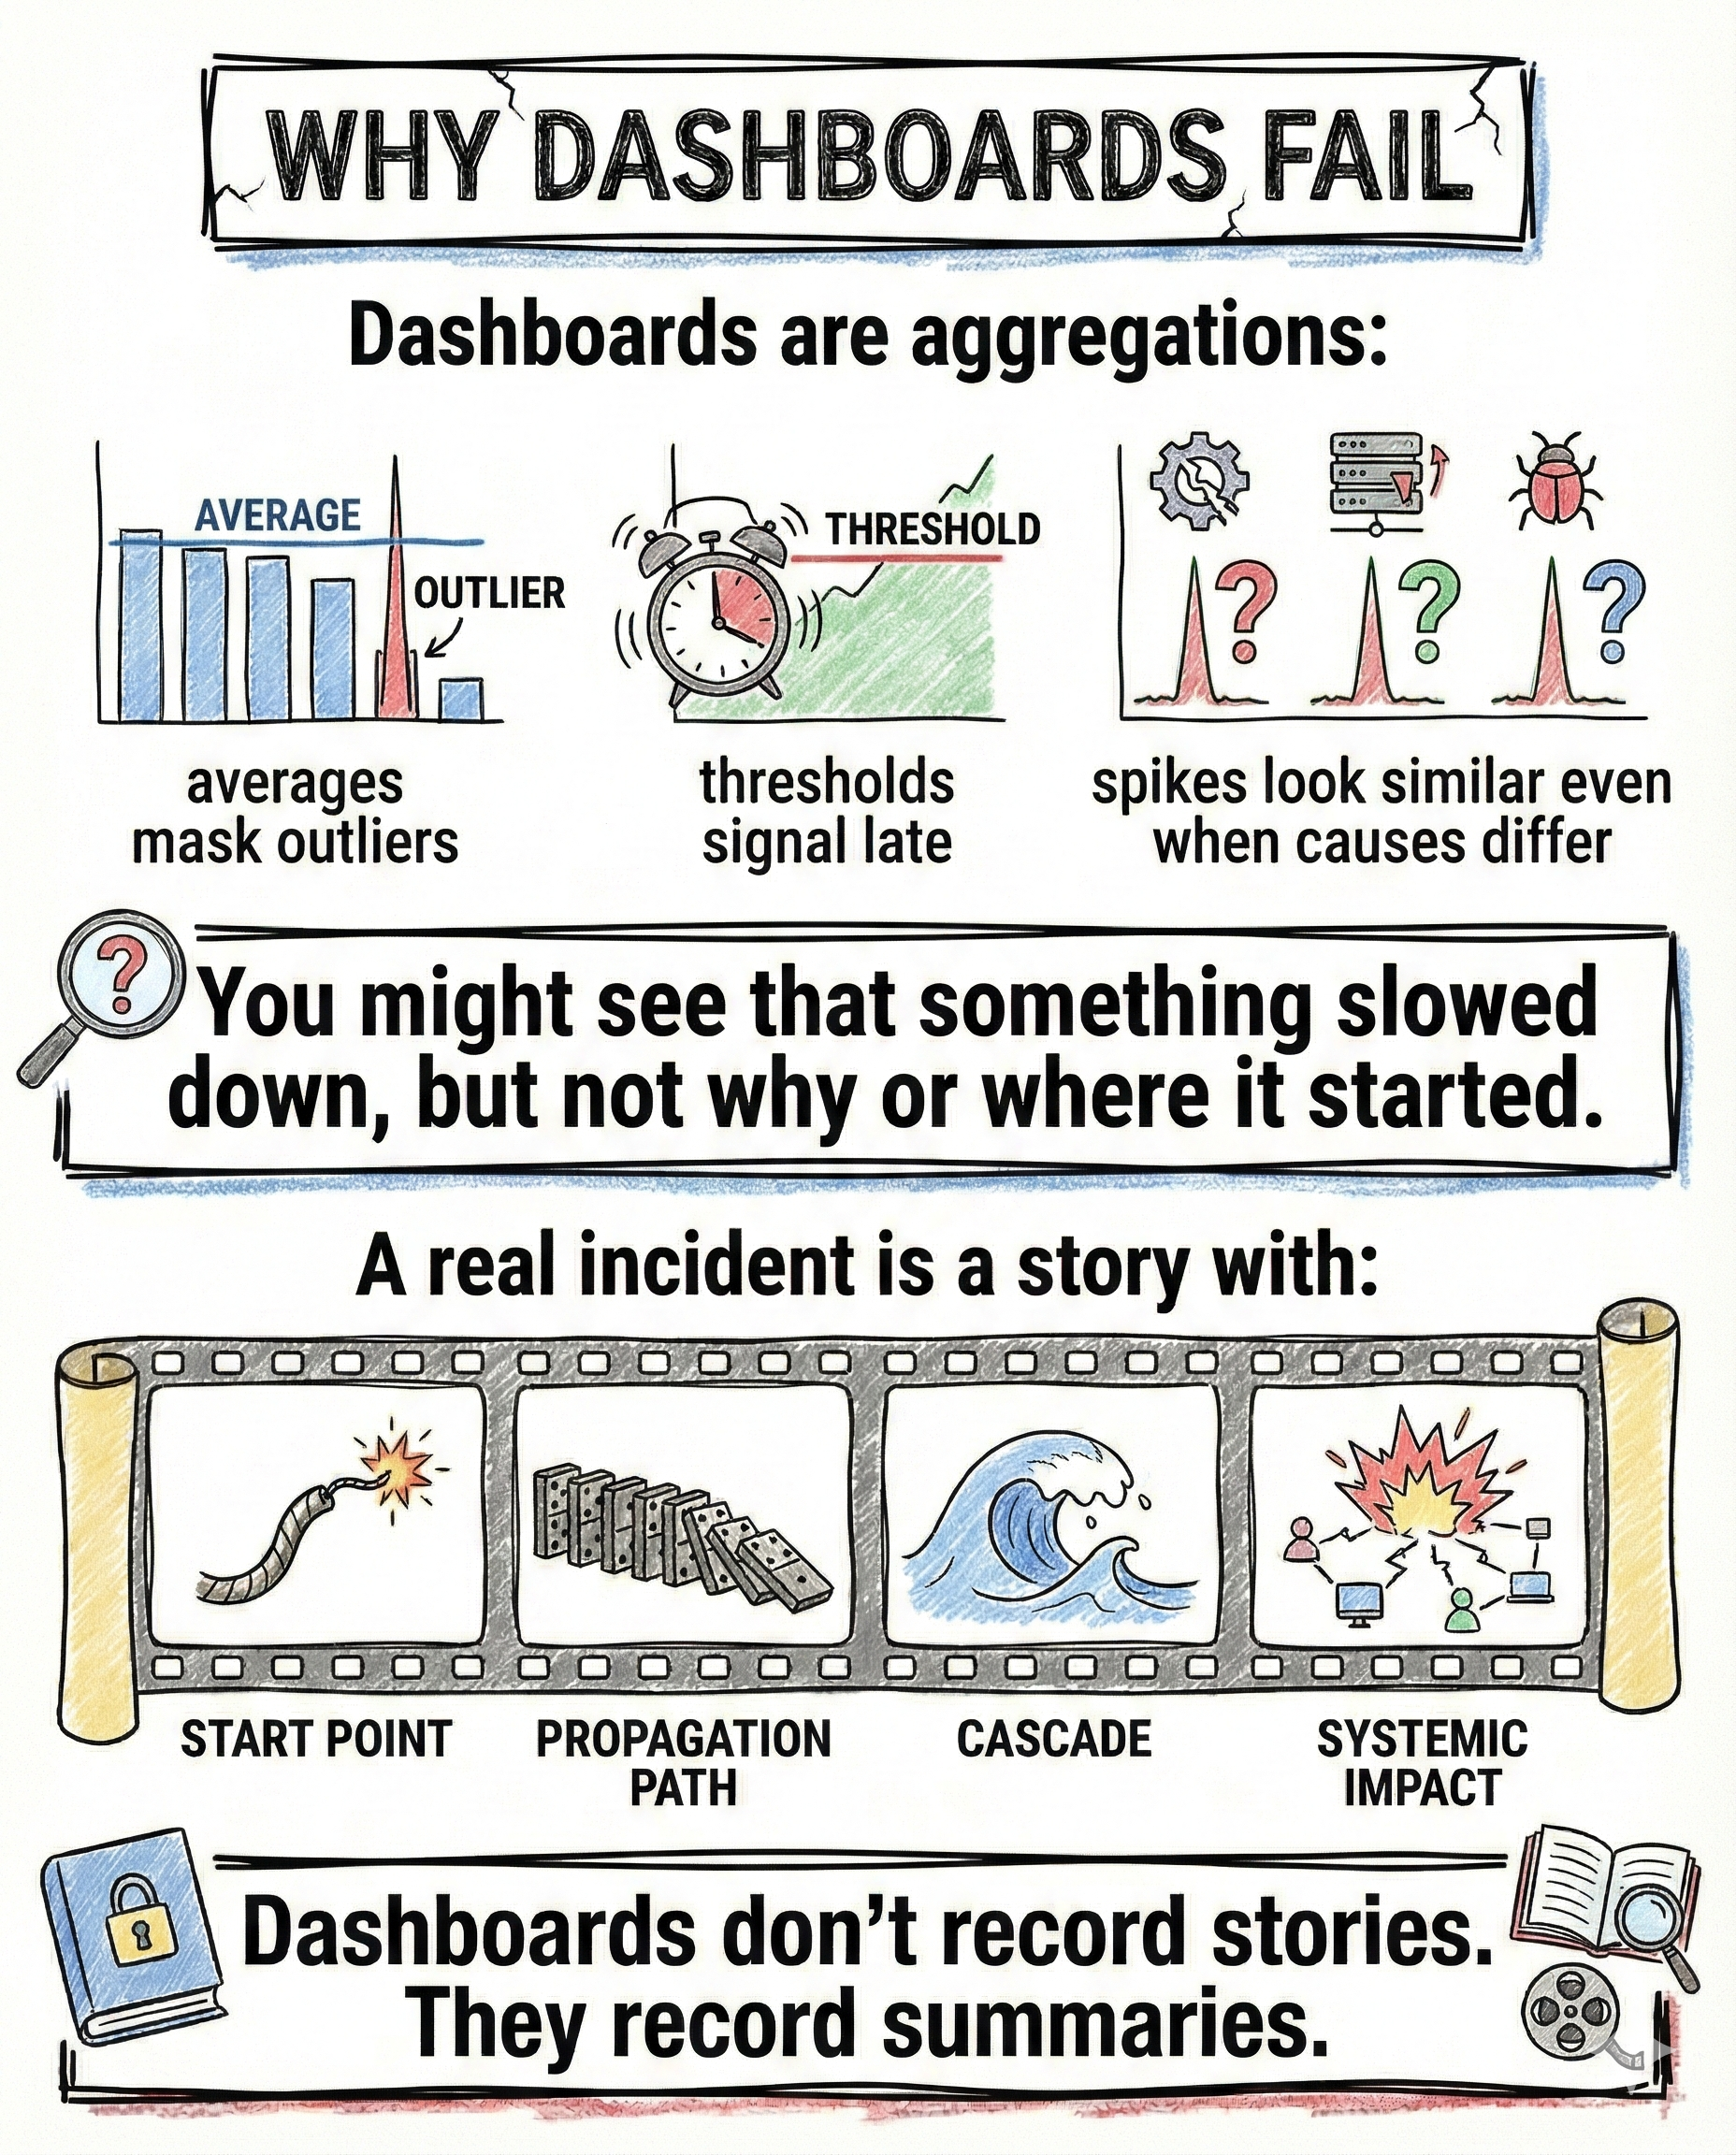
Dashboards are aggregations.
They fail because:
- averages hide outliers
- thresholds alert too late
- spikes look identical even when causes differ
A real incident is not a number.
It is a story.
Every incident has:
- a starting point
- a propagation path
- a cascade across systems
- a user-visible impact
Dashboards record summaries.
They do not record stories.
What changes at scale
As systems grow, failure modes change shape.
You start seeing:
- non-linear traffic behavior
- errors isolated to specific user cohorts
- intermittent resource contention
- unpredictable third-party degradation
At scale, context loss is the real enemy.
Logs without correlation are noise.
Traces without metadata are empty lines.
Metrics without dimensions are flat.
True observability treats incidents as time-aligned, context-rich sequences, not alerts.

How I think about observability now
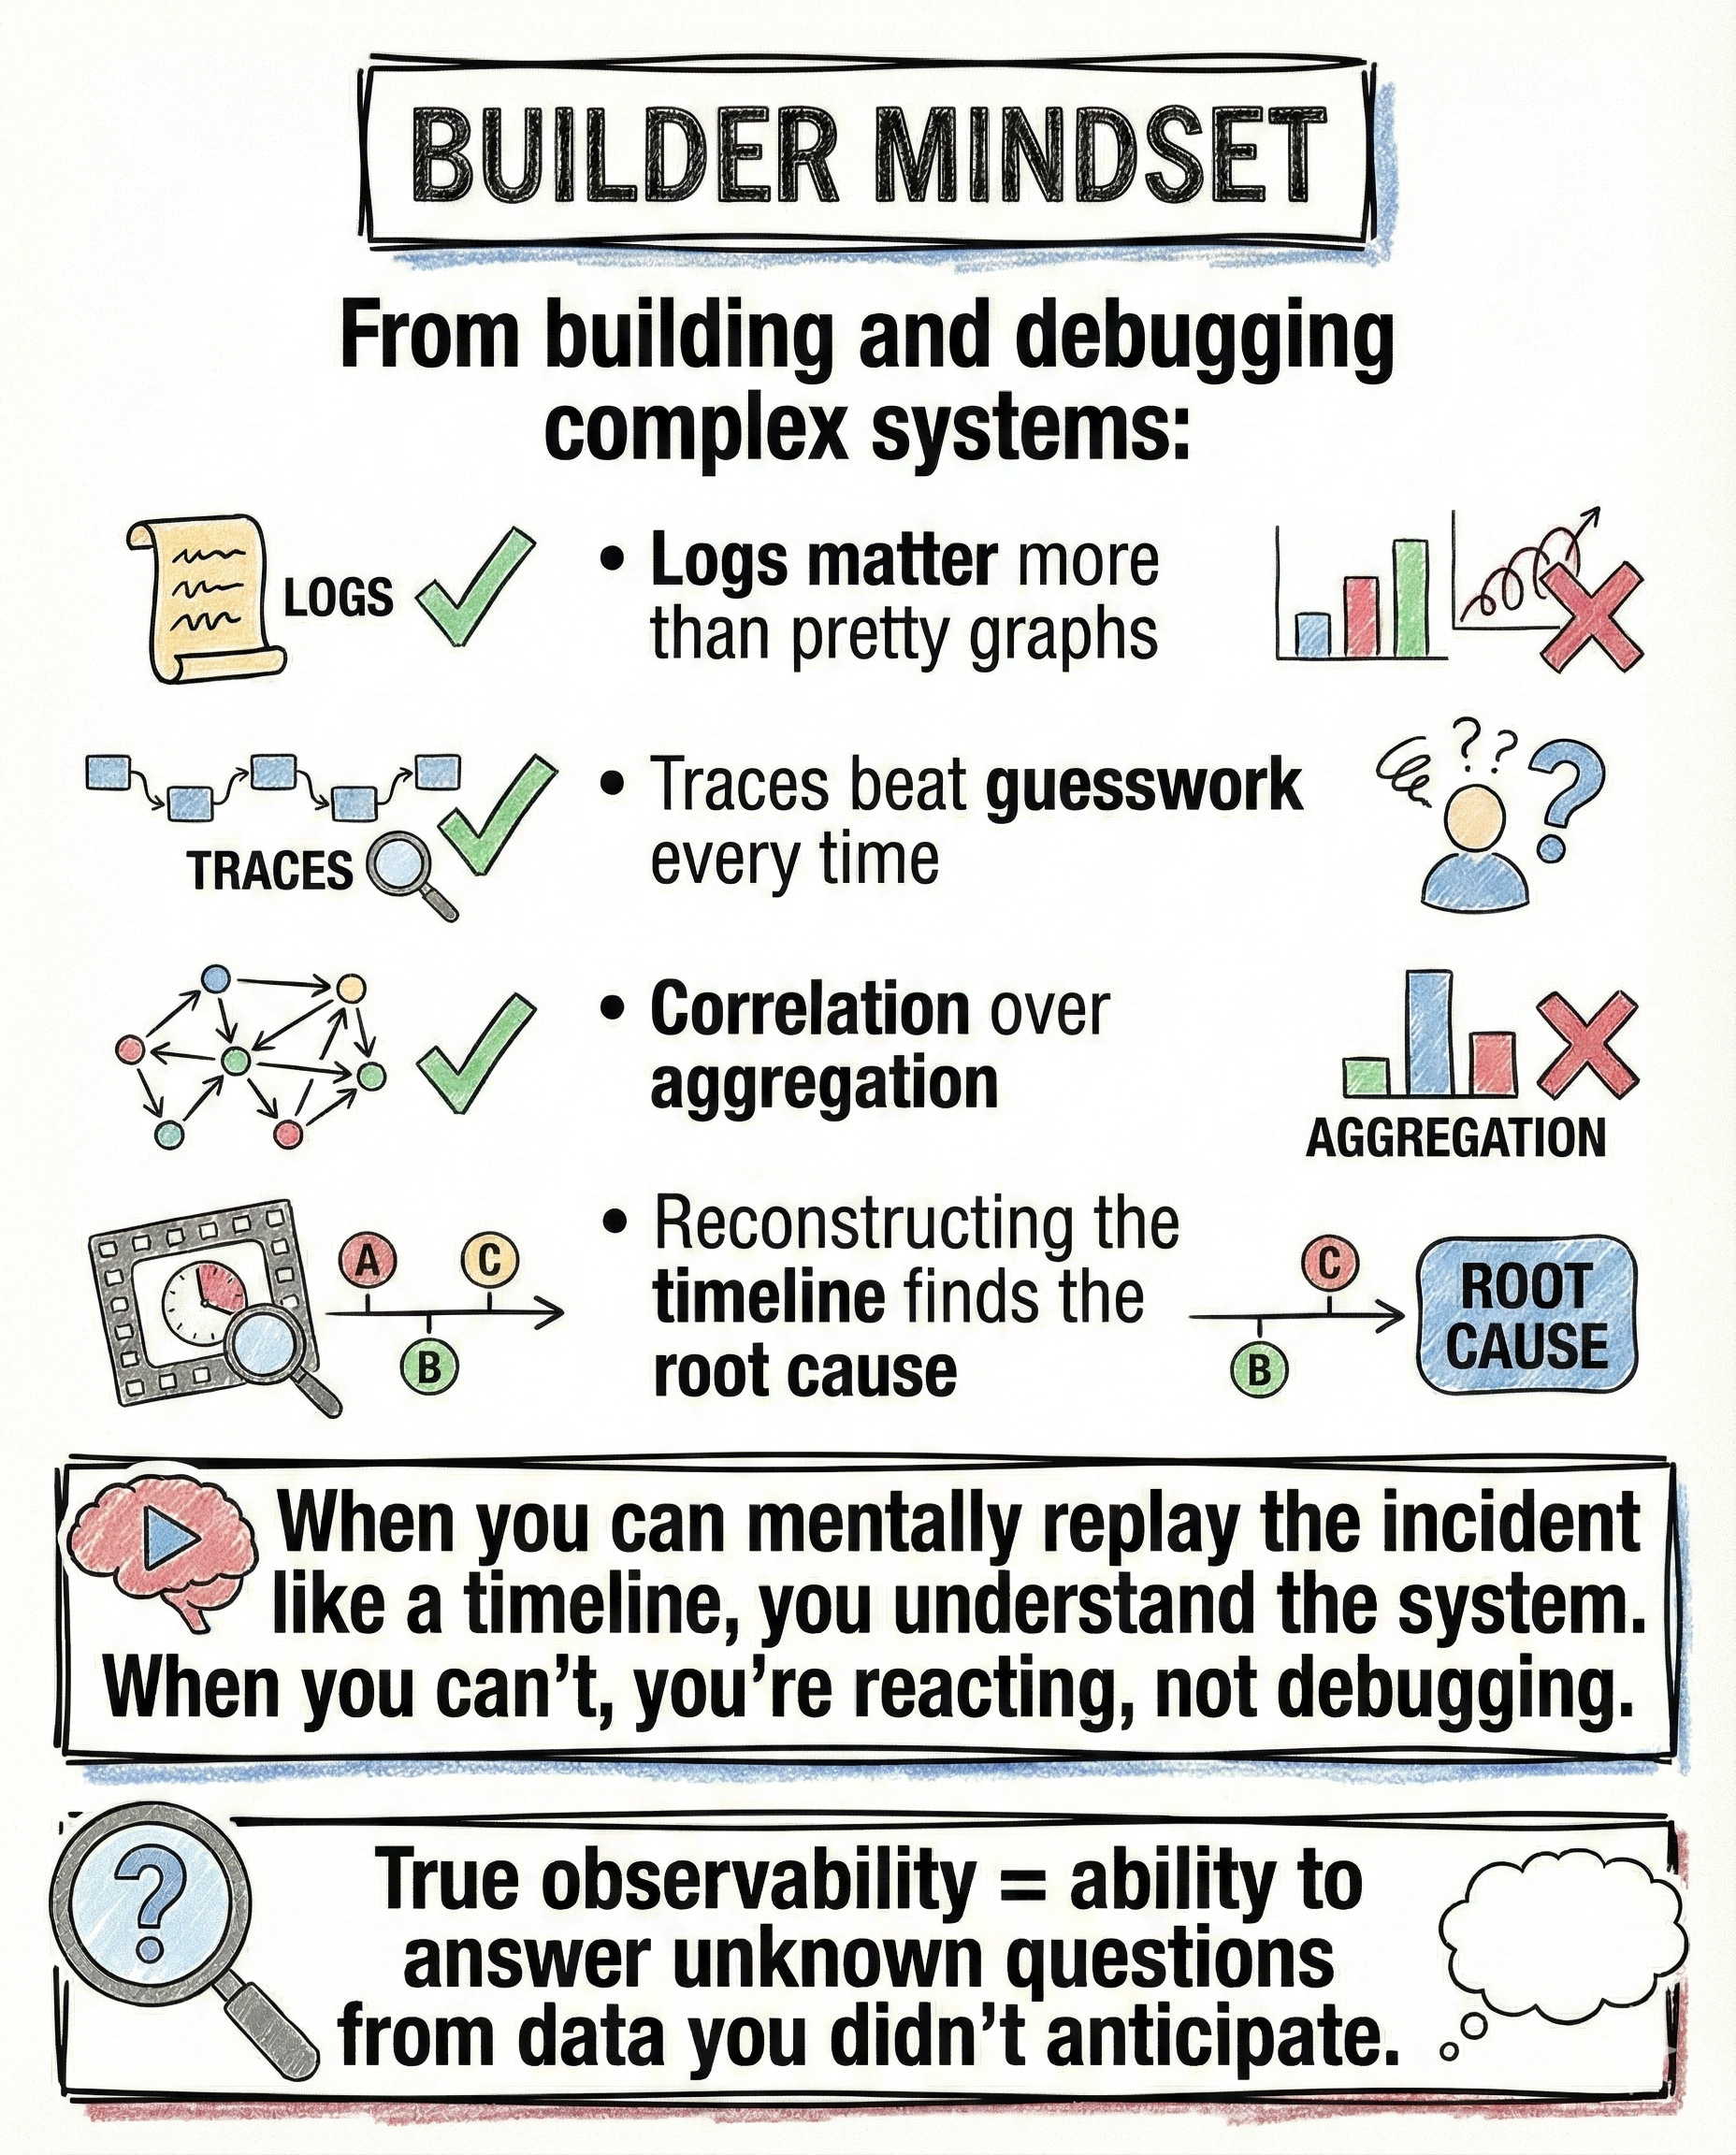
From building and debugging real systems:
- logs matter more than pretty graphs
- traces beat guesswork every time
- correlation beats aggregation
- timeline reconstruction finds root cause
If you can replay the incident mentally as a sequence, you understand the system.
If you cannot, you are reacting, not debugging.
True observability means you can answer questions you did not anticipate when you shipped the code.
A real failure pattern
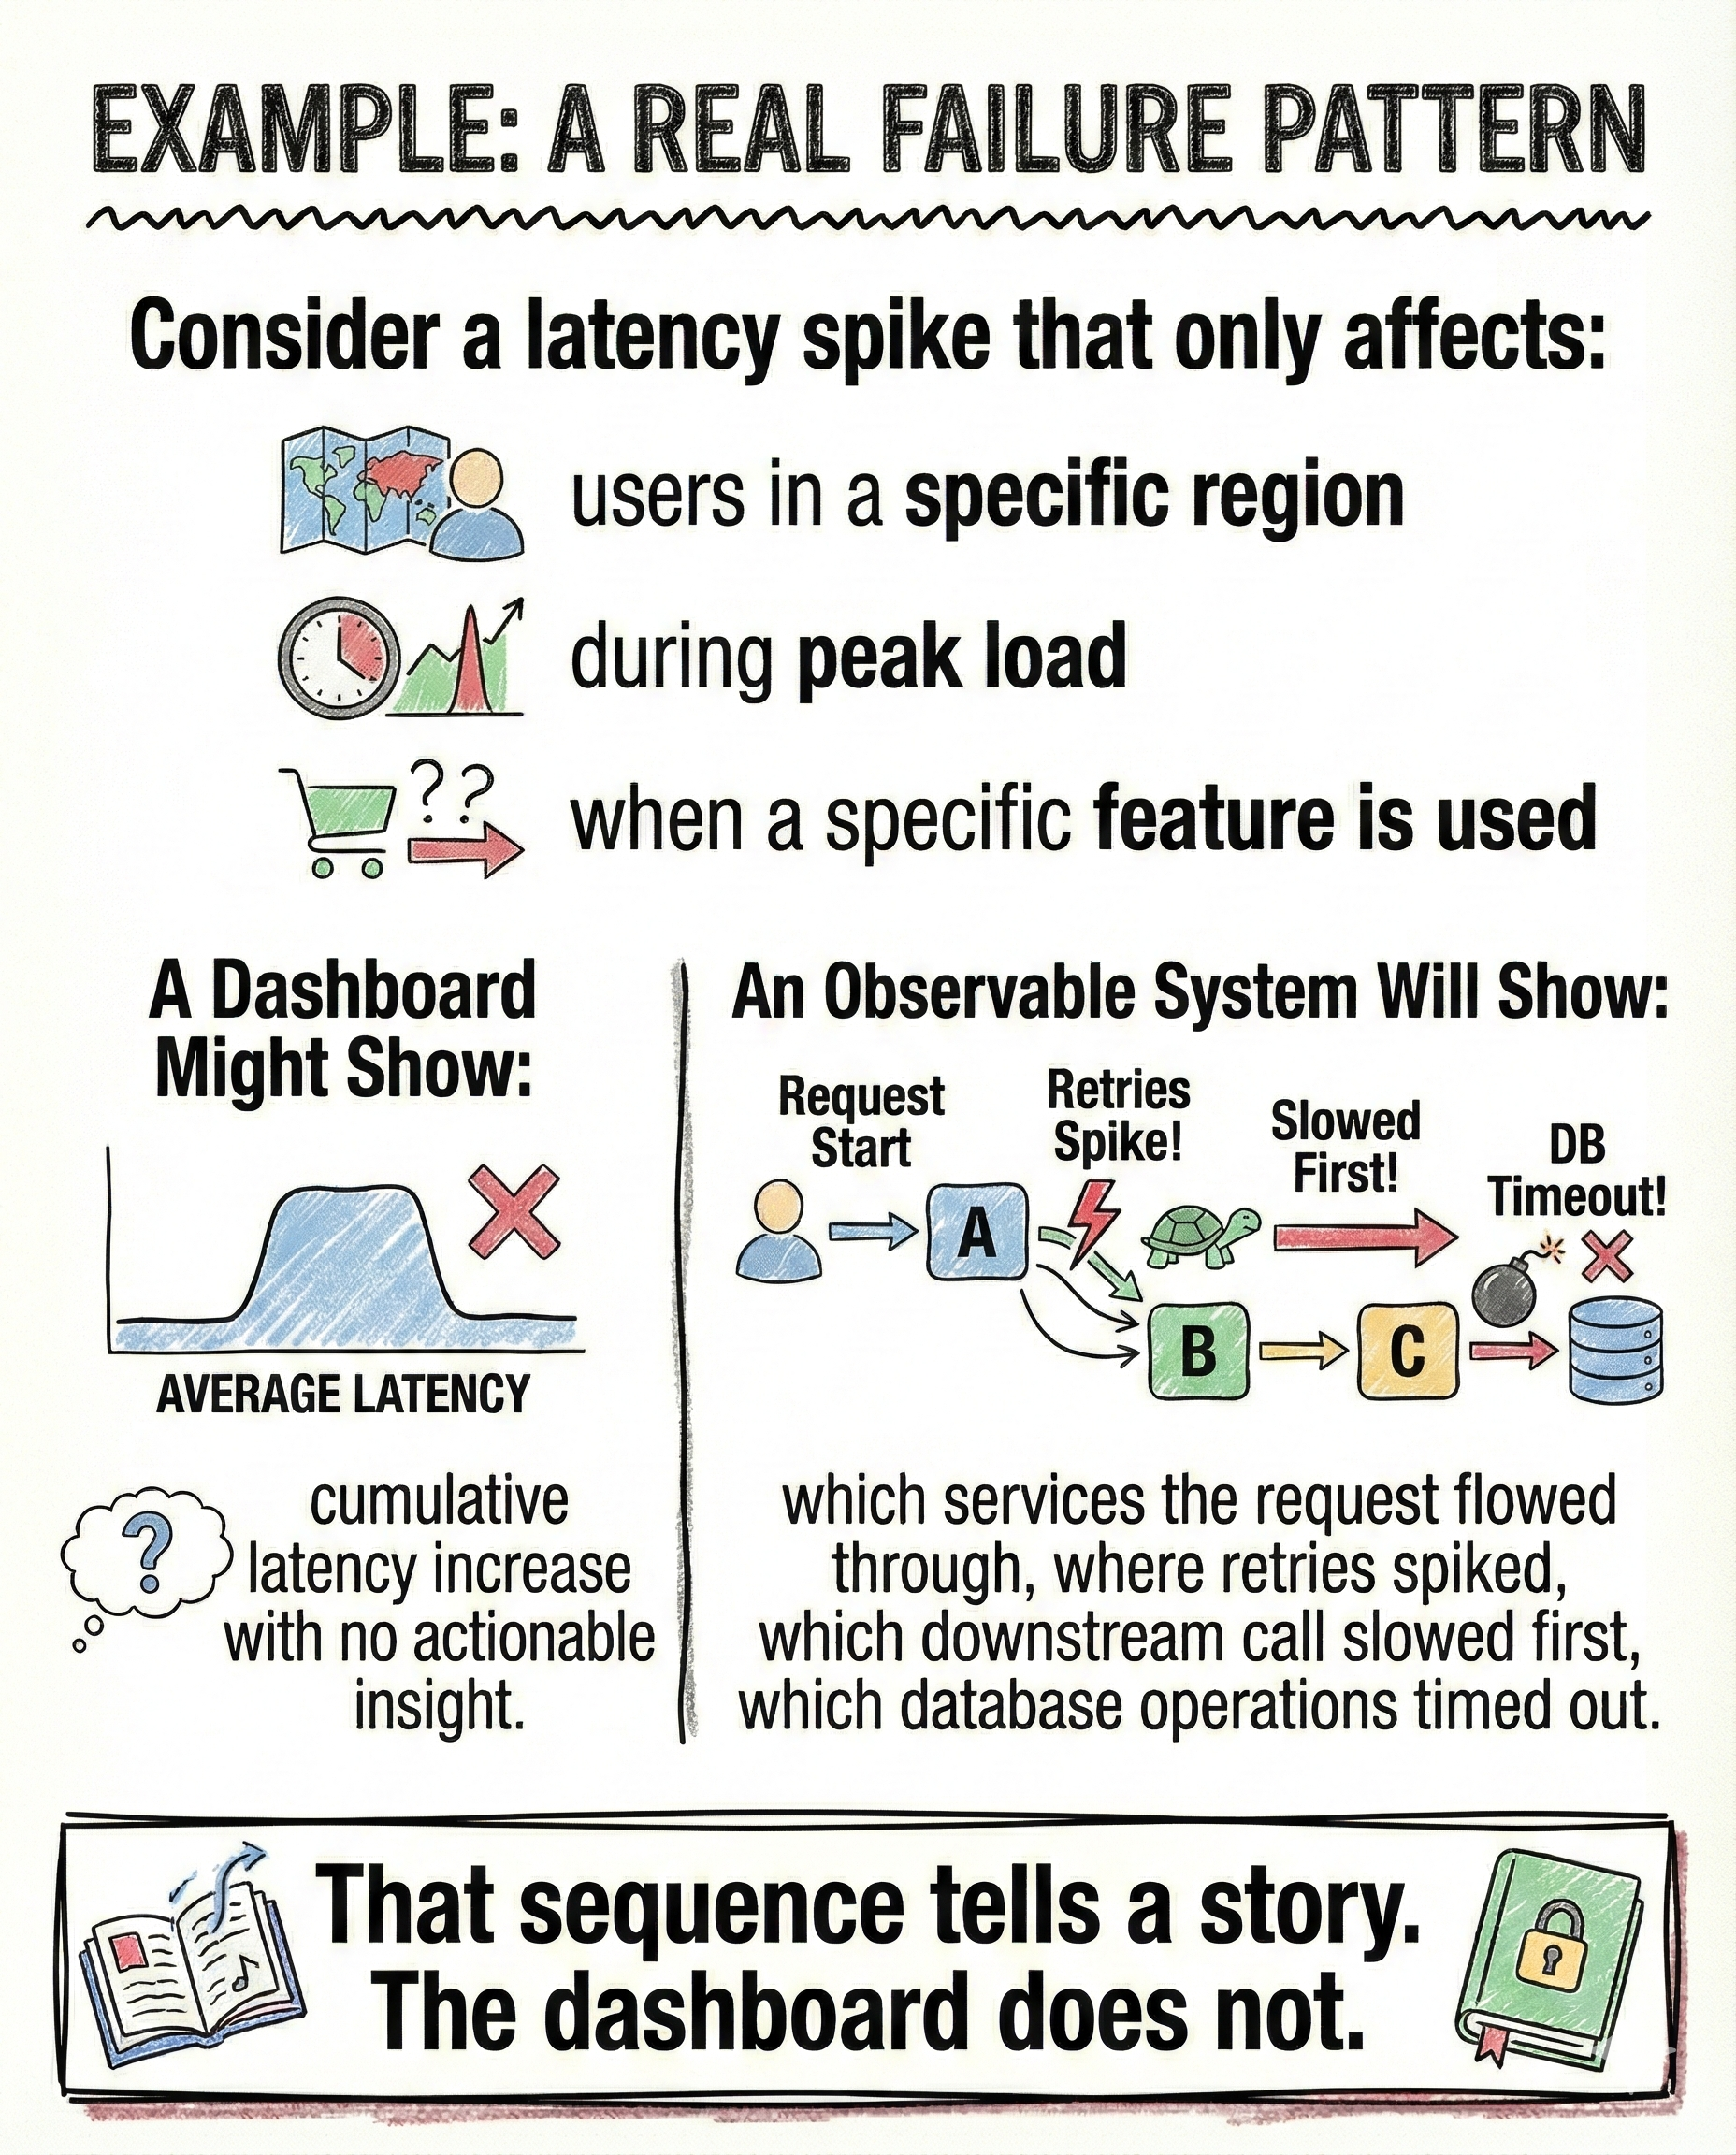
Imagine a latency spike that only affects:
- users in one region
- during peak load
- when a specific feature is used
A dashboard shows a generic latency increase.
An observable system shows:
- the exact services the request passed through
- where retries began
- which downstream dependency slowed first
- which database queries timed out
- how the failure propagated
That sequence explains the incident.
The dashboard never could.
The real takeaway
Dashboards are necessary.
They are not sufficient.
If you cannot reconstruct reality from your data, you do not have observability. You have charts.
Closing
This post is part of InsideTheStack, focused on engineering signals that explain reality instead of summarizing it.
Follow along for more.
#InsideTheStack #Observability #ProductionEngineering